| __timestamp | Lennox International Inc. | U-Haul Holding Company |
|---|---|---|
| Wednesday, January 1, 2014 | 903300000 | 2707982000 |
| Thursday, January 1, 2015 | 947400000 | 2928459000 |
| Friday, January 1, 2016 | 1076500000 | 3130666000 |
| Sunday, January 1, 2017 | 1125200000 | 3269282000 |
| Monday, January 1, 2018 | 1111200000 | 3440625000 |
| Tuesday, January 1, 2019 | 1079800000 | 3606565000 |
| Wednesday, January 1, 2020 | 1040100000 | 3814850000 |
| Friday, January 1, 2021 | 1188400000 | 4327926000 |
| Saturday, January 1, 2022 | 1284700000 | 5480162000 |
| Sunday, January 1, 2023 | 1547800000 | 5019797000 |
| Monday, January 1, 2024 | 1771900000 | 1649634000 |
In pursuit of knowledge
In the ever-evolving landscape of American industry, Lennox International Inc. and U-Haul Holding Company stand as titans in their respective fields. Over the past decade, from 2014 to 2024, these companies have showcased contrasting trajectories in gross profit performance. Lennox International, a leader in climate control solutions, has seen its gross profit grow by approximately 96%, peaking in 2024. Meanwhile, U-Haul, synonymous with moving and storage, experienced a remarkable 102% increase in gross profit by 2022, before a notable decline in 2024.
This performance breakdown highlights the resilience and adaptability of these companies amidst economic shifts. Lennox's steady climb reflects its strategic innovations, while U-Haul's fluctuations underscore the dynamic nature of consumer demand in the moving industry. As we look to the future, these trends offer valuable insights into the strategic directions of these industry leaders.
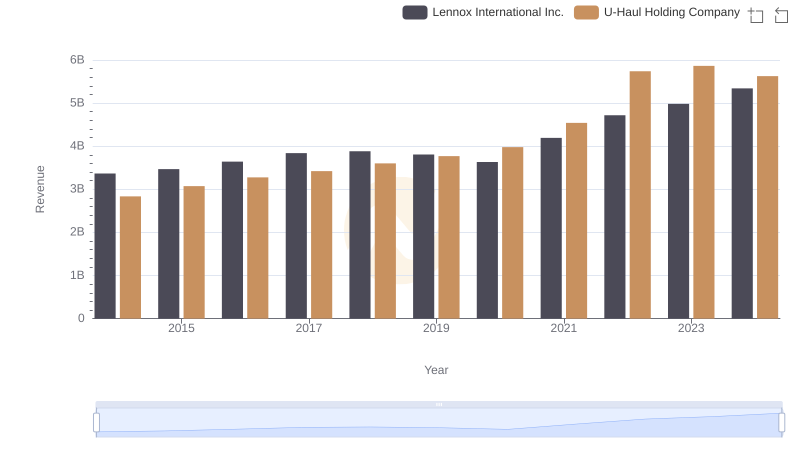
Lennox International Inc. and U-Haul Holding Company: A Comprehensive Revenue Analysis
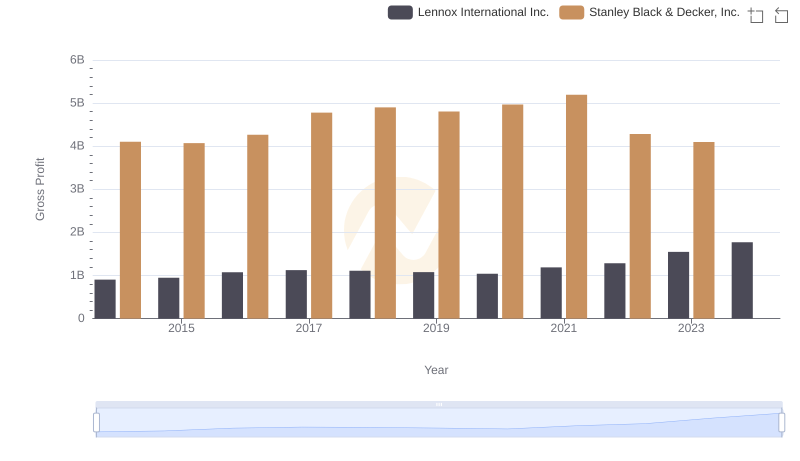
Lennox International Inc. vs Stanley Black & Decker, Inc.: A Gross Profit Performance Breakdown
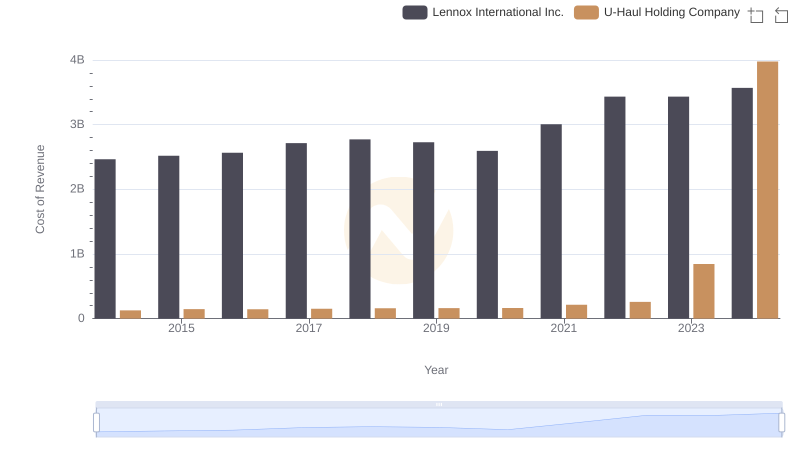
Cost Insights: Breaking Down Lennox International Inc. and U-Haul Holding Company's Expenses
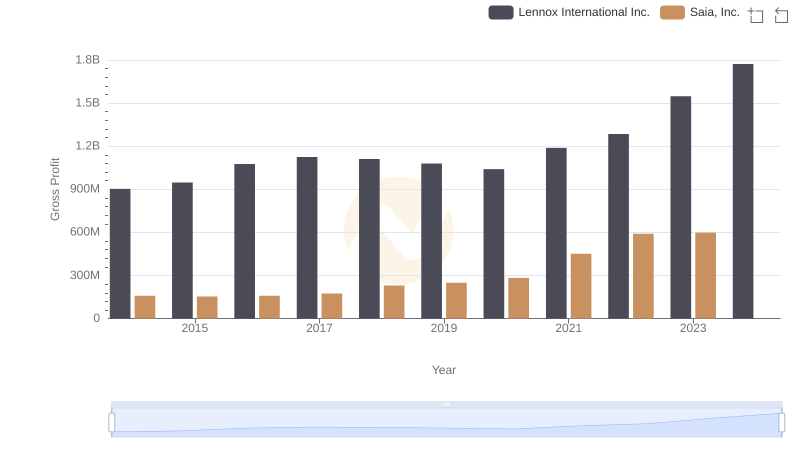
Gross Profit Trends Compared: Lennox International Inc. vs Saia, Inc.
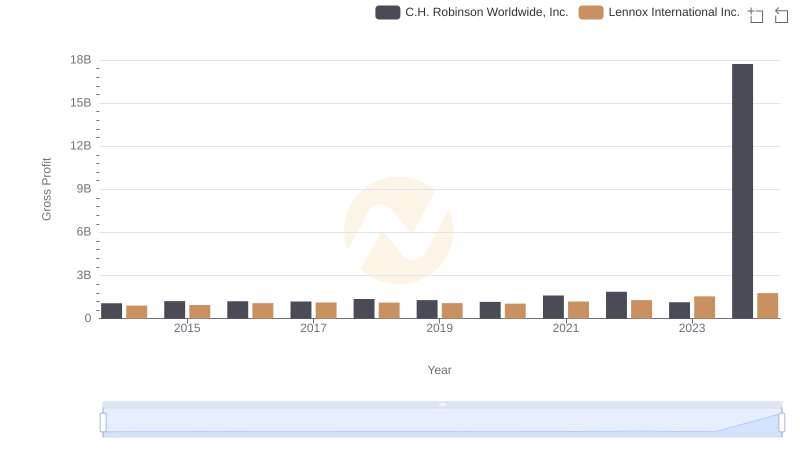
Gross Profit Analysis: Comparing Lennox International Inc. and C.H. Robinson Worldwide, Inc.
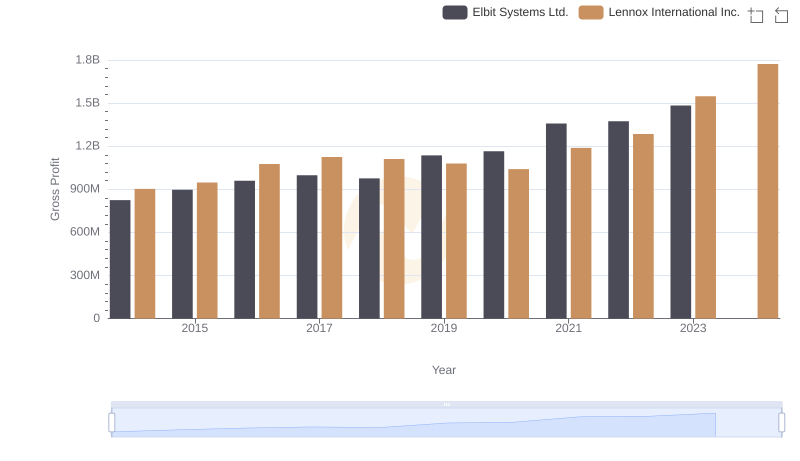
Gross Profit Comparison: Lennox International Inc. and Elbit Systems Ltd. Trends
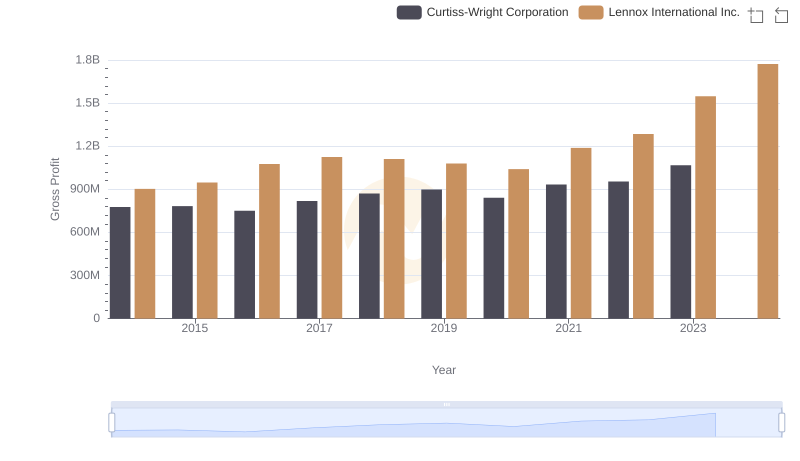
Gross Profit Trends Compared: Lennox International Inc. vs Curtiss-Wright Corporation
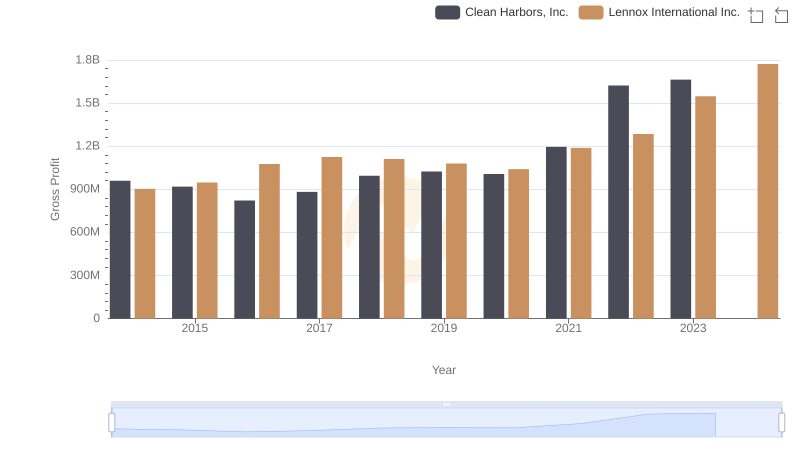
Gross Profit Trends Compared: Lennox International Inc. vs Clean Harbors, Inc.
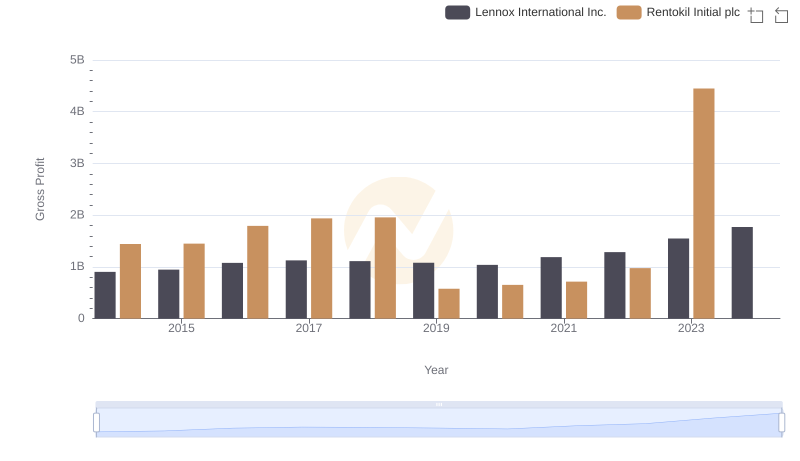
Gross Profit Comparison: Lennox International Inc. and Rentokil Initial plc Trends
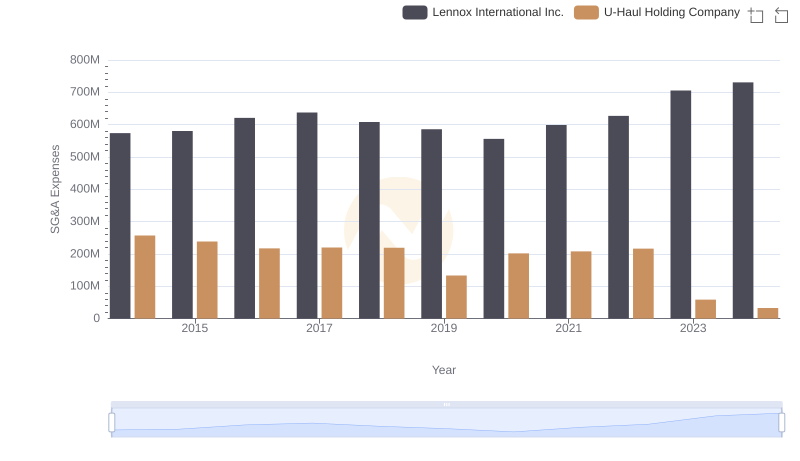
Selling, General, and Administrative Costs: Lennox International Inc. vs U-Haul Holding Company
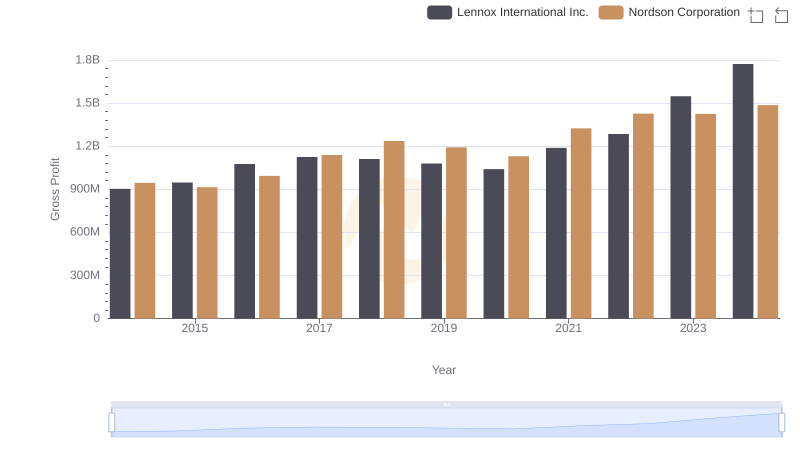
Gross Profit Trends Compared: Lennox International Inc. vs Nordson Corporation
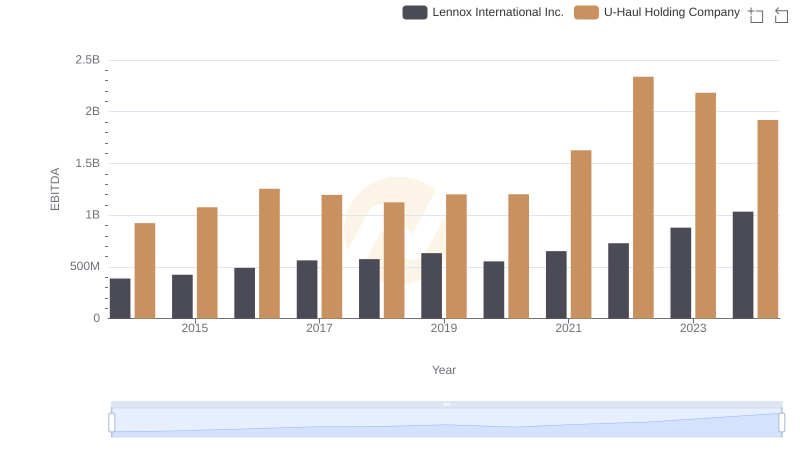
A Professional Review of EBITDA: Lennox International Inc. Compared to U-Haul Holding Company