| __timestamp | CNH Industrial N.V. | Lennox International Inc. |
|---|---|---|
| Wednesday, January 1, 2014 | 7021000000 | 903300000 |
| Thursday, January 1, 2015 | 5555000000 | 947400000 |
| Friday, January 1, 2016 | 5333000000 | 1076500000 |
| Sunday, January 1, 2017 | 5740000000 | 1125200000 |
| Monday, January 1, 2018 | 6748000000 | 1111200000 |
| Tuesday, January 1, 2019 | 6247000000 | 1079800000 |
| Wednesday, January 1, 2020 | 4705000000 | 1040100000 |
| Friday, January 1, 2021 | 7477000000 | 1188400000 |
| Saturday, January 1, 2022 | 6754000000 | 1284700000 |
| Sunday, January 1, 2023 | 7889000000 | 1547800000 |
| Monday, January 1, 2024 | 1771900000 |
Data in motion
In the ever-evolving landscape of industrial giants, Lennox International Inc. and CNH Industrial N.V. have showcased intriguing trends in their gross profits over the past decade. From 2014 to 2023, CNH Industrial N.V. experienced a rollercoaster ride, with gross profits peaking in 2023 at approximately 7.9 billion, a 12% increase from 2022. Meanwhile, Lennox International Inc. demonstrated a steady upward trajectory, culminating in a remarkable 71% growth from 2014 to 2023, reaching around 1.5 billion.
The data reveals a fascinating narrative of resilience and growth, with Lennox International Inc. consistently closing the gap with its larger counterpart. As we look to the future, the missing data for 2024 leaves room for speculation and anticipation. This analysis underscores the dynamic nature of the industrial sector and the strategic maneuvers of these two formidable companies.
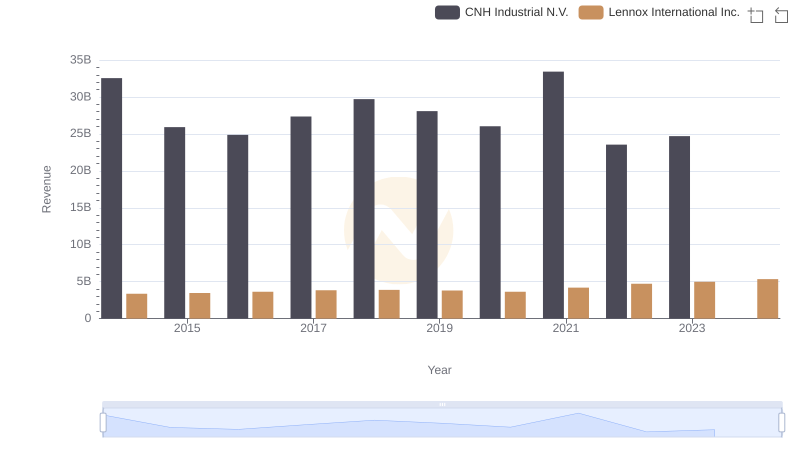
Lennox International Inc. and CNH Industrial N.V.: A Comprehensive Revenue Analysis
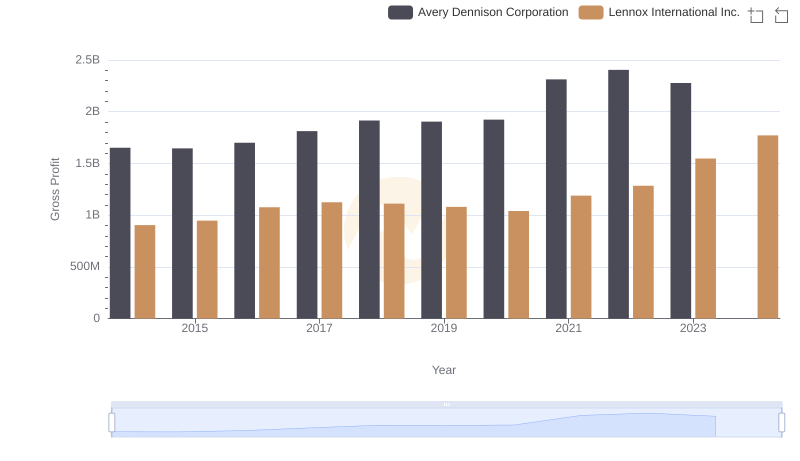
Gross Profit Analysis: Comparing Lennox International Inc. and Avery Dennison Corporation
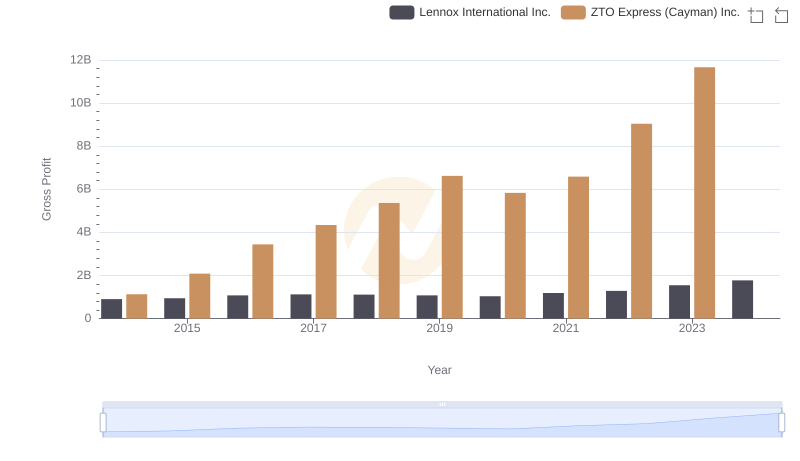
Gross Profit Comparison: Lennox International Inc. and ZTO Express (Cayman) Inc. Trends
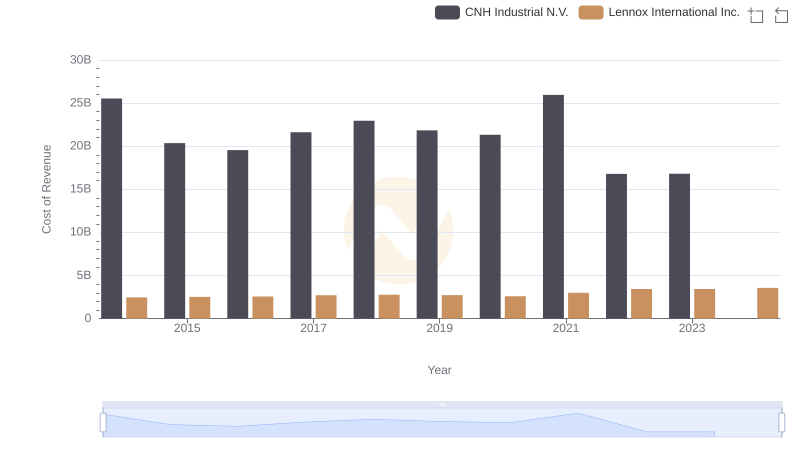
Cost of Revenue Trends: Lennox International Inc. vs CNH Industrial N.V.
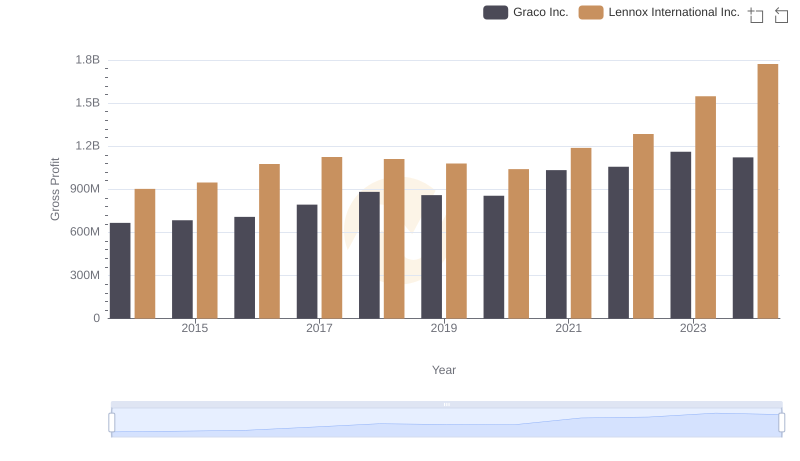
Lennox International Inc. and Graco Inc.: A Detailed Gross Profit Analysis
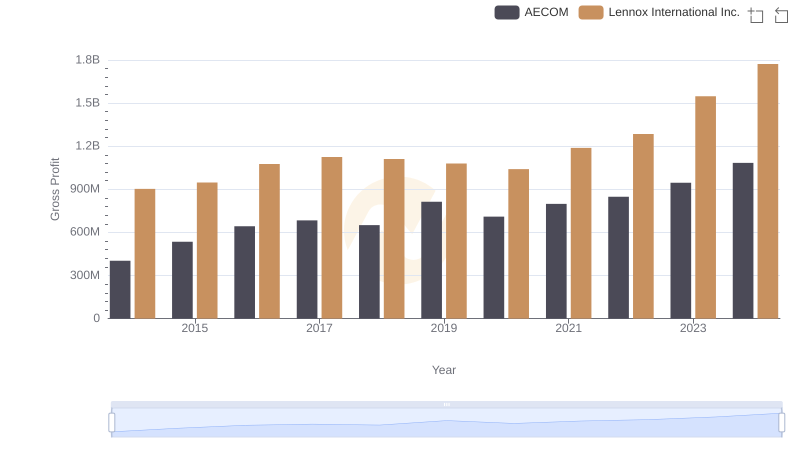
Lennox International Inc. vs AECOM: A Gross Profit Performance Breakdown
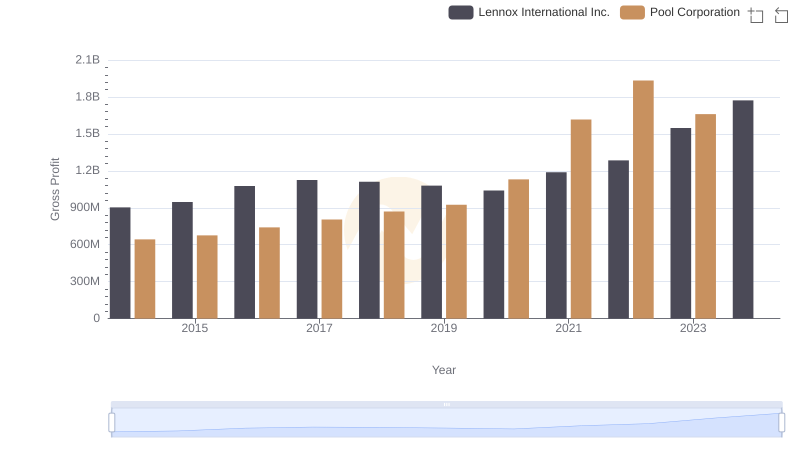
Key Insights on Gross Profit: Lennox International Inc. vs Pool Corporation
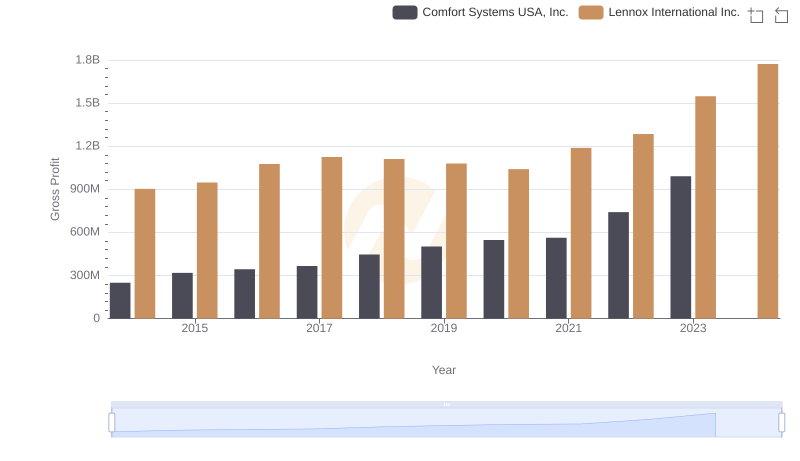
Lennox International Inc. and Comfort Systems USA, Inc.: A Detailed Gross Profit Analysis
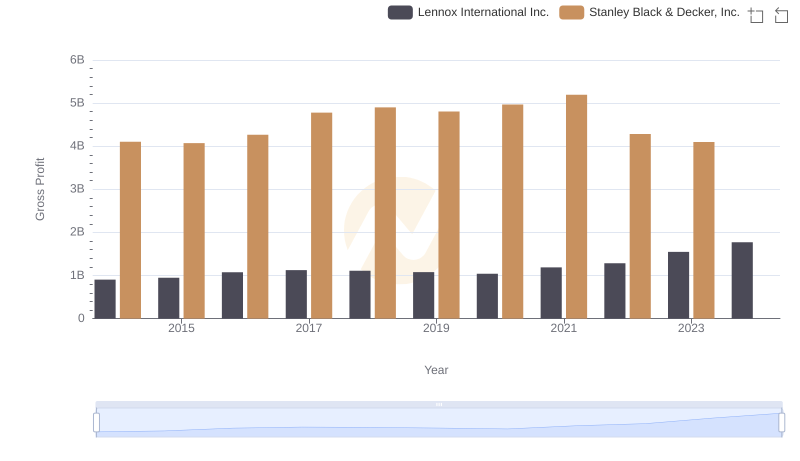
Lennox International Inc. vs Stanley Black & Decker, Inc.: A Gross Profit Performance Breakdown
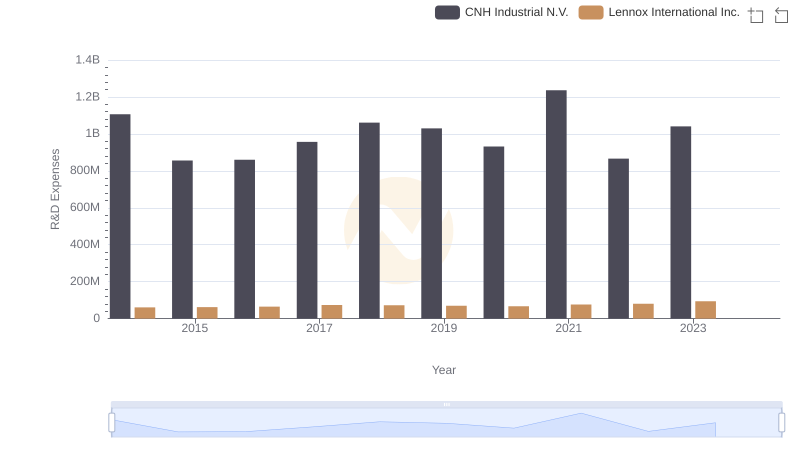
Comparing Innovation Spending: Lennox International Inc. and CNH Industrial N.V.
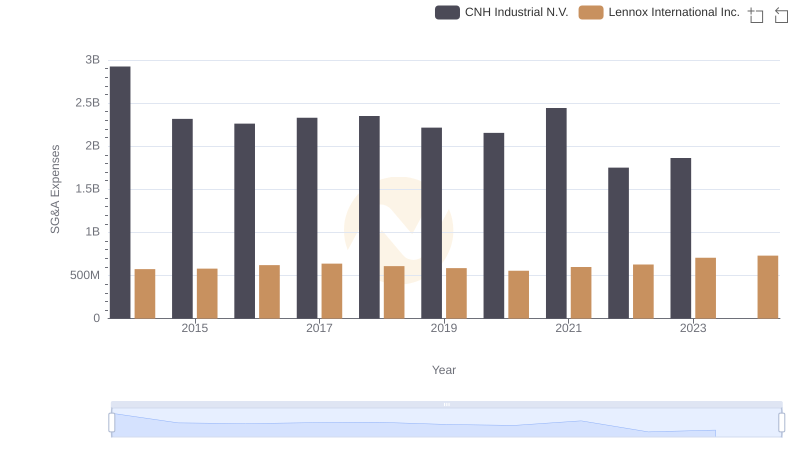
Breaking Down SG&A Expenses: Lennox International Inc. vs CNH Industrial N.V.
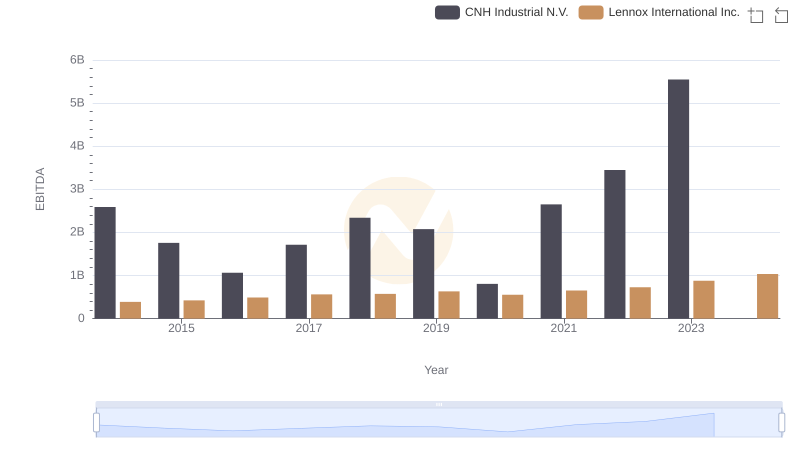
Comprehensive EBITDA Comparison: Lennox International Inc. vs CNH Industrial N.V.