| __timestamp | Graco Inc. | Lennox International Inc. |
|---|---|---|
| Wednesday, January 1, 2014 | 666736000 | 903300000 |
| Thursday, January 1, 2015 | 684700000 | 947400000 |
| Friday, January 1, 2016 | 708239000 | 1076500000 |
| Sunday, January 1, 2017 | 793049000 | 1125200000 |
| Monday, January 1, 2018 | 882539000 | 1111200000 |
| Tuesday, January 1, 2019 | 859756000 | 1079800000 |
| Wednesday, January 1, 2020 | 854937000 | 1040100000 |
| Friday, January 1, 2021 | 1033949000 | 1188400000 |
| Saturday, January 1, 2022 | 1057439000 | 1284700000 |
| Sunday, January 1, 2023 | 1161021000 | 1547800000 |
| Monday, January 1, 2024 | 1122461000 | 1771900000 |
Unveiling the hidden dimensions of data
In the ever-evolving landscape of industrial manufacturing, Lennox International Inc. and Graco Inc. have demonstrated remarkable resilience and growth over the past decade. From 2014 to 2024, Lennox International's gross profit surged by approximately 96%, reflecting its robust market strategies and operational efficiencies. Meanwhile, Graco Inc. also showcased a commendable growth of around 68% in the same period, underscoring its stronghold in the fluid handling industry.
These trends highlight the dynamic nature of the industrial sector and the strategic maneuvers by these companies to capitalize on market opportunities.
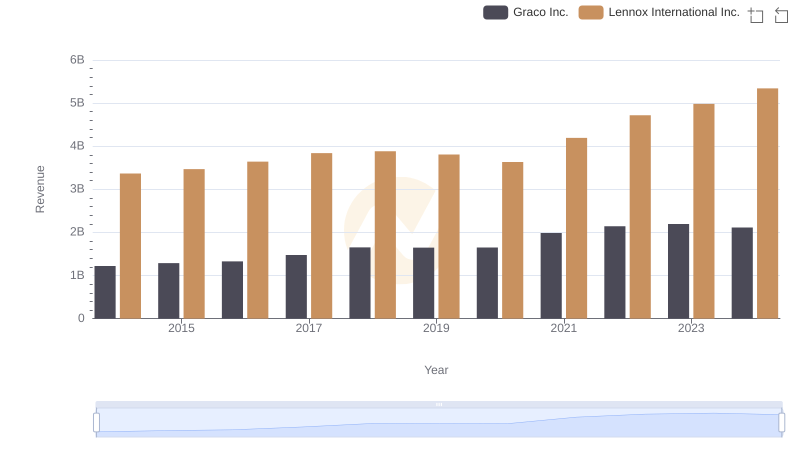
Revenue Showdown: Lennox International Inc. vs Graco Inc.
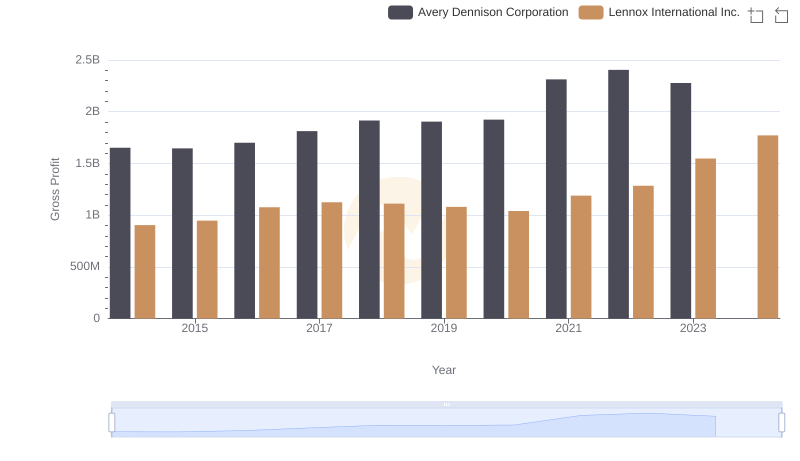
Gross Profit Analysis: Comparing Lennox International Inc. and Avery Dennison Corporation
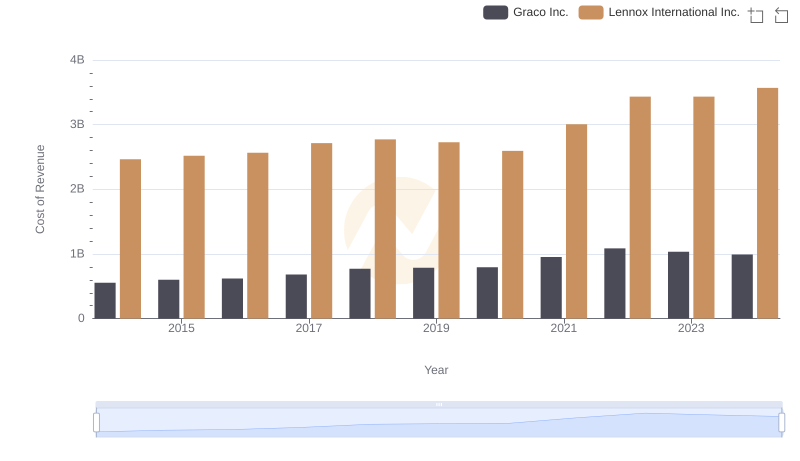
Cost of Revenue Comparison: Lennox International Inc. vs Graco Inc.
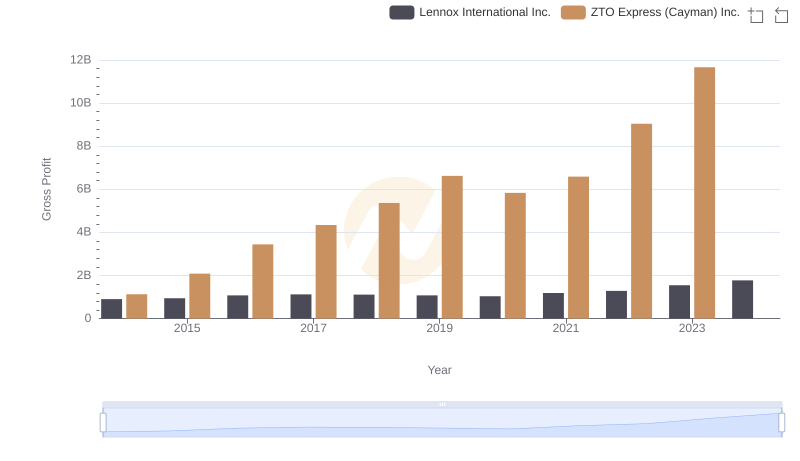
Gross Profit Comparison: Lennox International Inc. and ZTO Express (Cayman) Inc. Trends
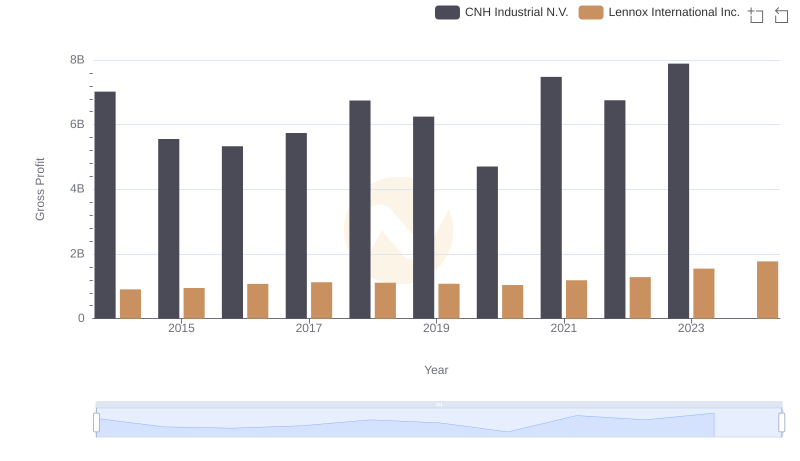
Lennox International Inc. and CNH Industrial N.V.: A Detailed Gross Profit Analysis
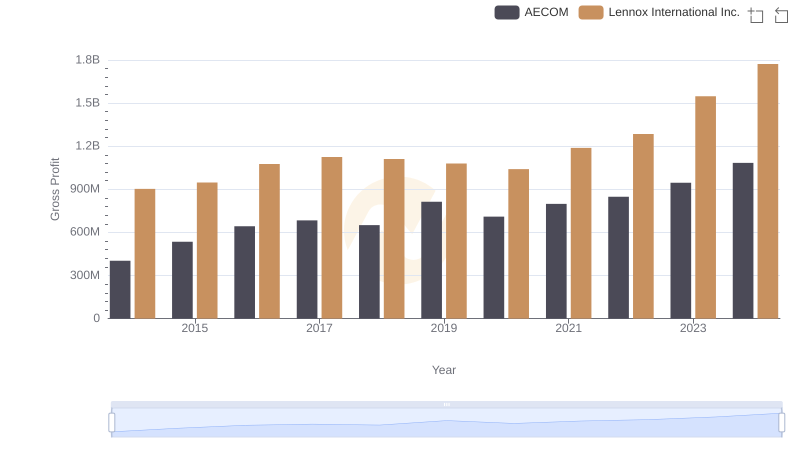
Lennox International Inc. vs AECOM: A Gross Profit Performance Breakdown
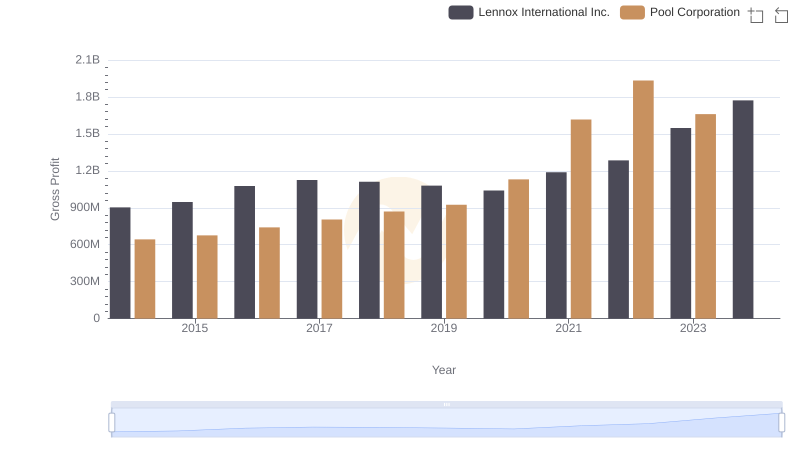
Key Insights on Gross Profit: Lennox International Inc. vs Pool Corporation
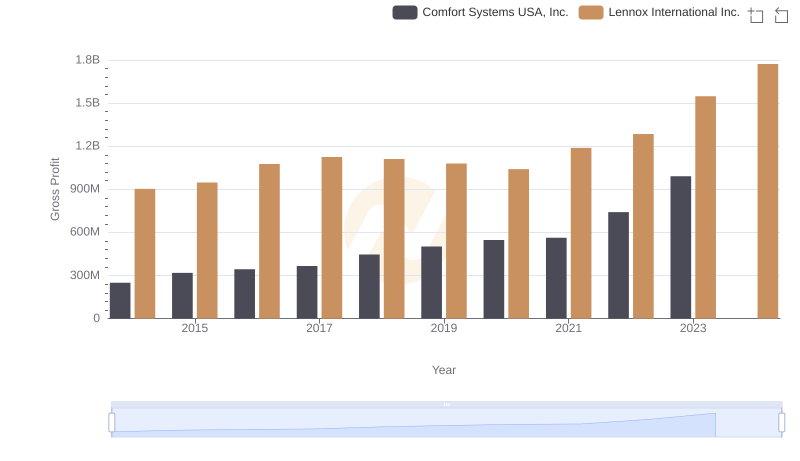
Lennox International Inc. and Comfort Systems USA, Inc.: A Detailed Gross Profit Analysis
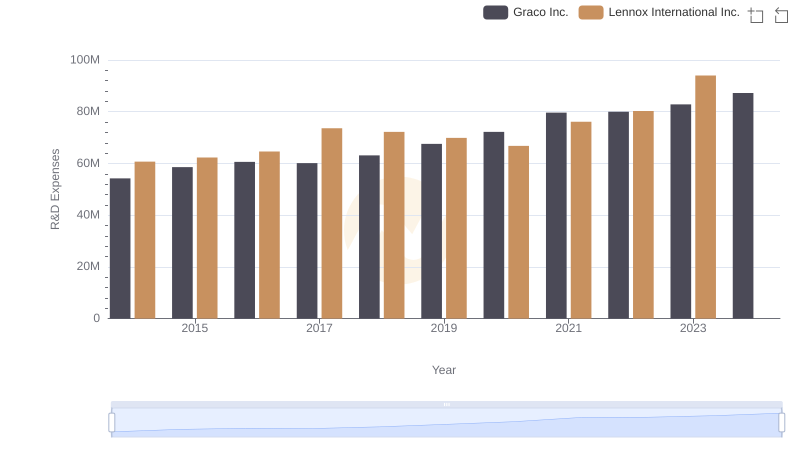
Lennox International Inc. or Graco Inc.: Who Invests More in Innovation?
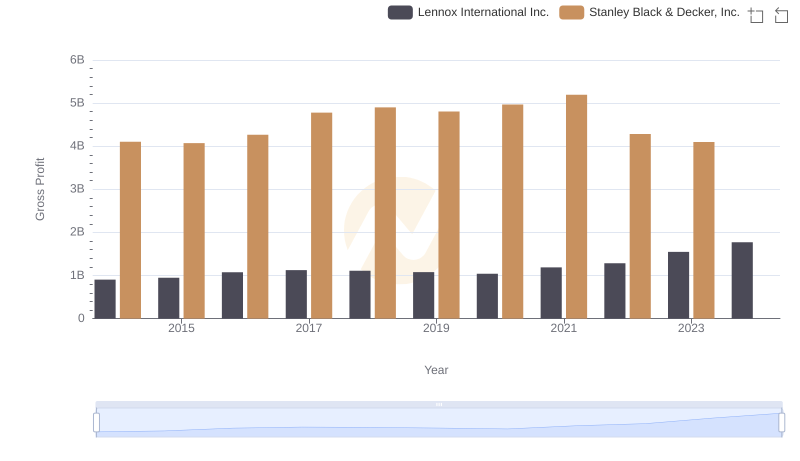
Lennox International Inc. vs Stanley Black & Decker, Inc.: A Gross Profit Performance Breakdown
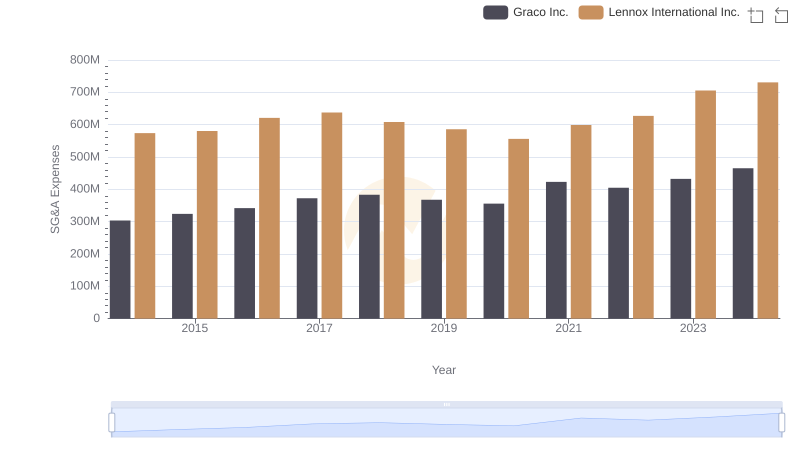
Who Optimizes SG&A Costs Better? Lennox International Inc. or Graco Inc.
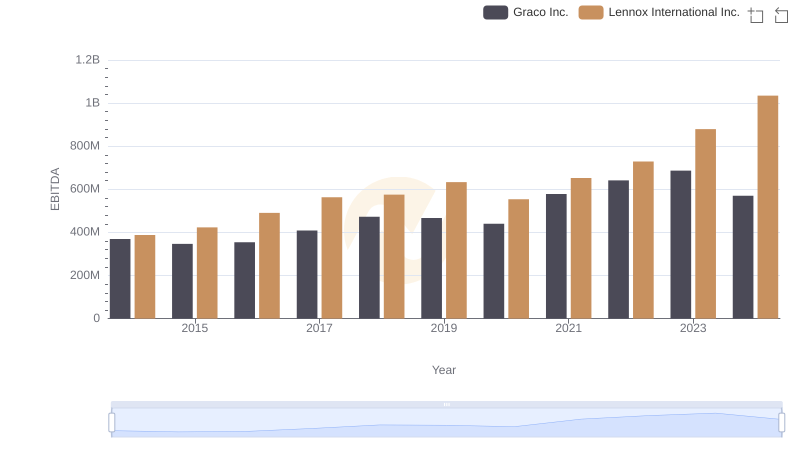
Comparative EBITDA Analysis: Lennox International Inc. vs Graco Inc.