| __timestamp | Fidelity National Information Services, Inc. | Intuit Inc. |
|---|---|---|
| Wednesday, January 1, 2014 | 810500000 | 1762000000 |
| Thursday, January 1, 2015 | 1102800000 | 1771000000 |
| Friday, January 1, 2016 | 1710000000 | 1807000000 |
| Sunday, January 1, 2017 | 1442000000 | 1973000000 |
| Monday, January 1, 2018 | 1301000000 | 2298000000 |
| Tuesday, January 1, 2019 | 2667000000 | 2524000000 |
| Wednesday, January 1, 2020 | 3516000000 | 2727000000 |
| Friday, January 1, 2021 | 3938000000 | 3626000000 |
| Saturday, January 1, 2022 | 4118000000 | 4986000000 |
| Sunday, January 1, 2023 | 2096000000 | 5062000000 |
| Monday, January 1, 2024 | 2185000000 | 5730000000 |
Infusing magic into the data realm
In the ever-evolving landscape of financial technology, Intuit Inc. and Fidelity National Information Services, Inc. (FIS) have emerged as pivotal players. Over the past decade, their Selling, General, and Administrative (SG&A) expenses have showcased intriguing trends. From 2014 to 2023, Intuit's SG&A expenses surged by approximately 187%, peaking in 2023. This reflects their aggressive expansion and innovation strategies. Meanwhile, FIS experienced a 159% increase until 2022, with a notable dip in 2023, possibly indicating strategic cost optimizations or market adjustments.
These trends offer a window into the strategic priorities of these fintech giants, highlighting their adaptive strategies in a competitive market.
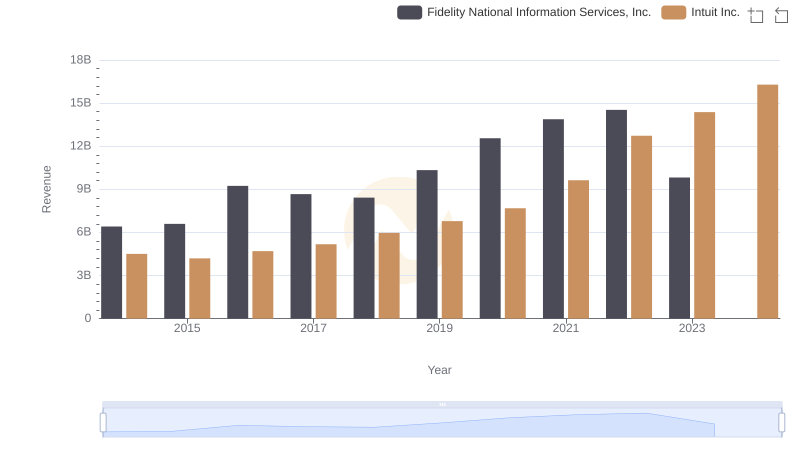
Revenue Insights: Intuit Inc. and Fidelity National Information Services, Inc. Performance Compared
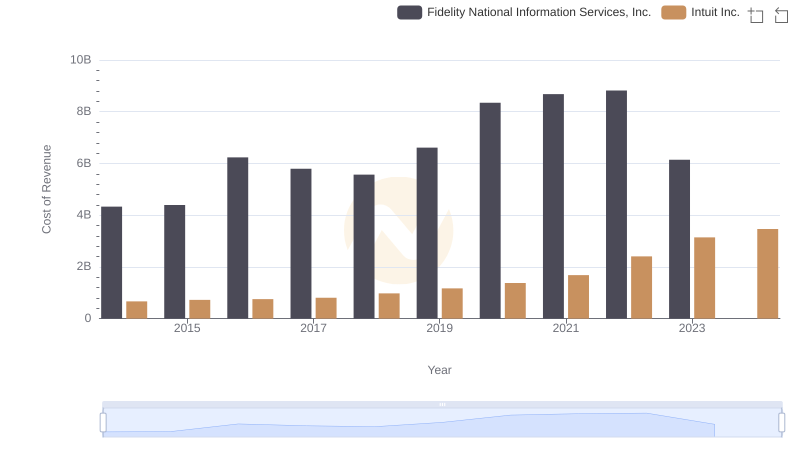
Intuit Inc. vs Fidelity National Information Services, Inc.: Efficiency in Cost of Revenue Explored
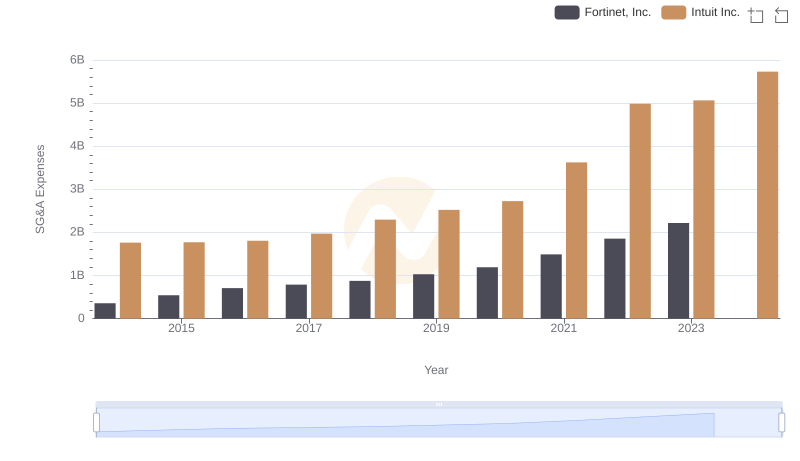
SG&A Efficiency Analysis: Comparing Intuit Inc. and Fortinet, Inc.
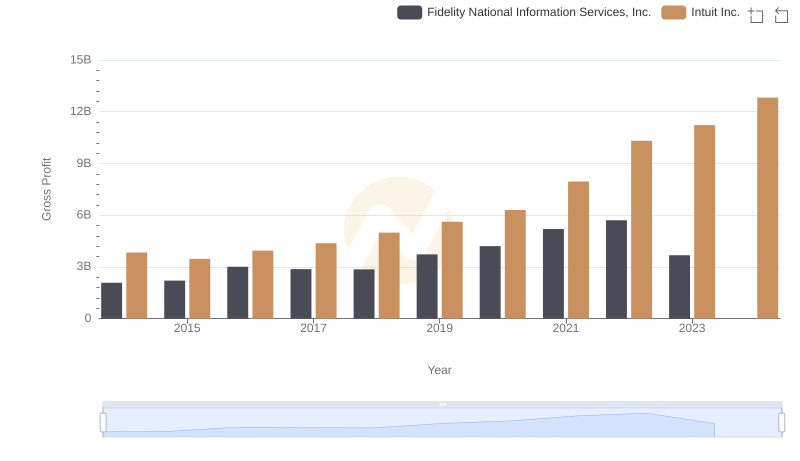
Gross Profit Analysis: Comparing Intuit Inc. and Fidelity National Information Services, Inc.
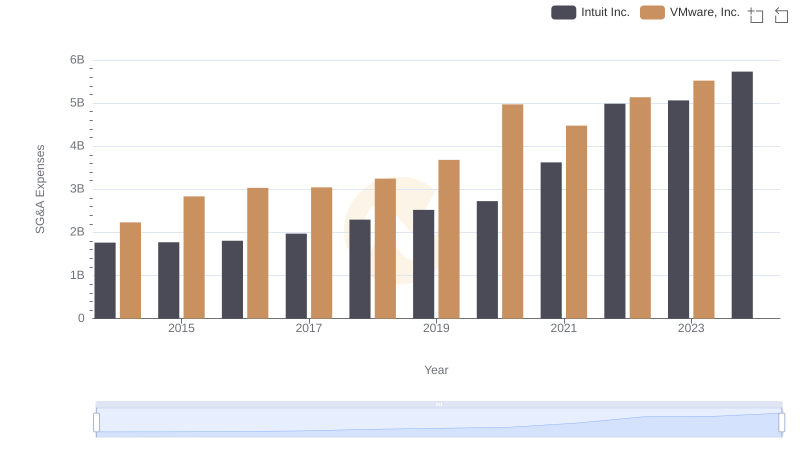
Cost Management Insights: SG&A Expenses for Intuit Inc. and VMware, Inc.
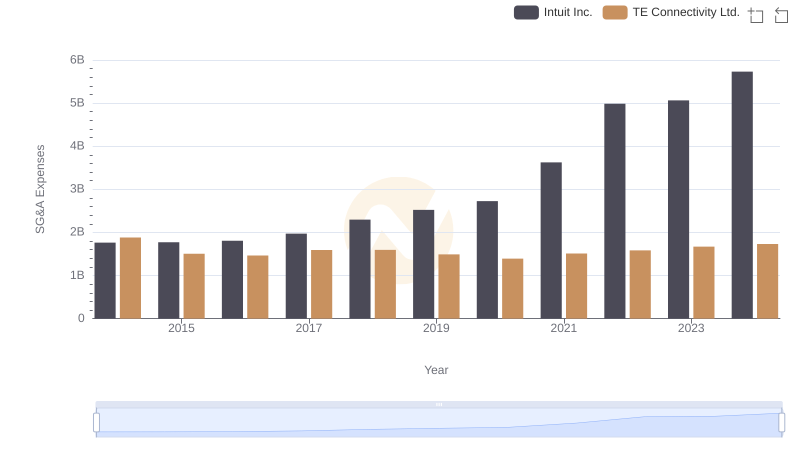
Cost Management Insights: SG&A Expenses for Intuit Inc. and TE Connectivity Ltd.
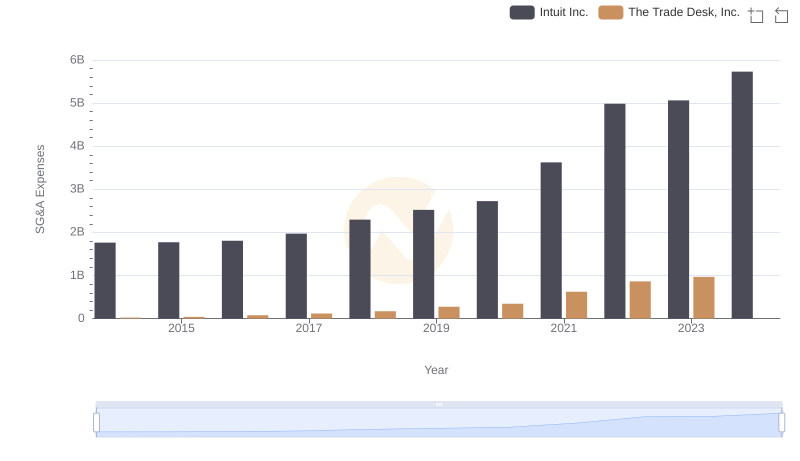
Intuit Inc. vs The Trade Desk, Inc.: SG&A Expense Trends
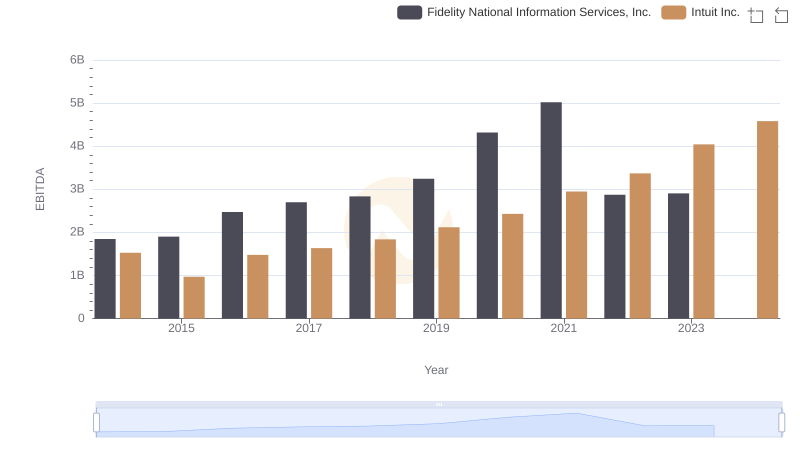
Comparative EBITDA Analysis: Intuit Inc. vs Fidelity National Information Services, Inc.
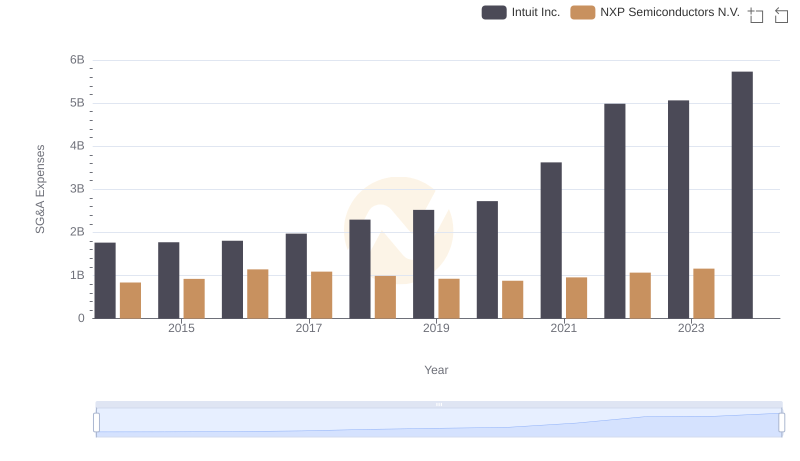
Cost Management Insights: SG&A Expenses for Intuit Inc. and NXP Semiconductors N.V.
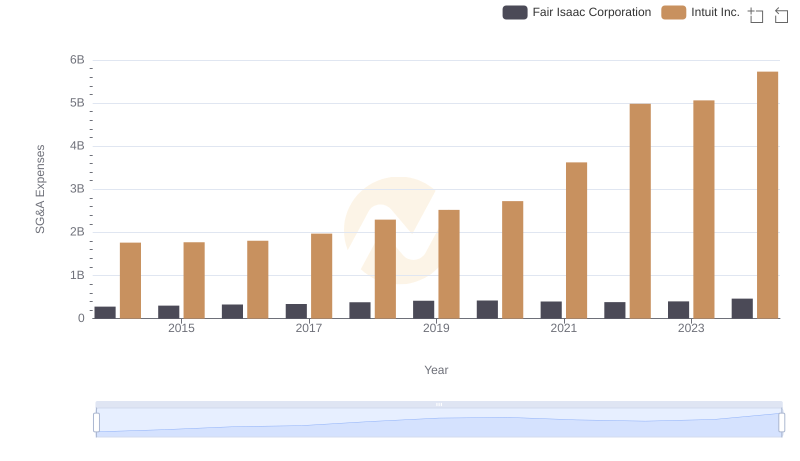
Comparing SG&A Expenses: Intuit Inc. vs Fair Isaac Corporation Trends and Insights
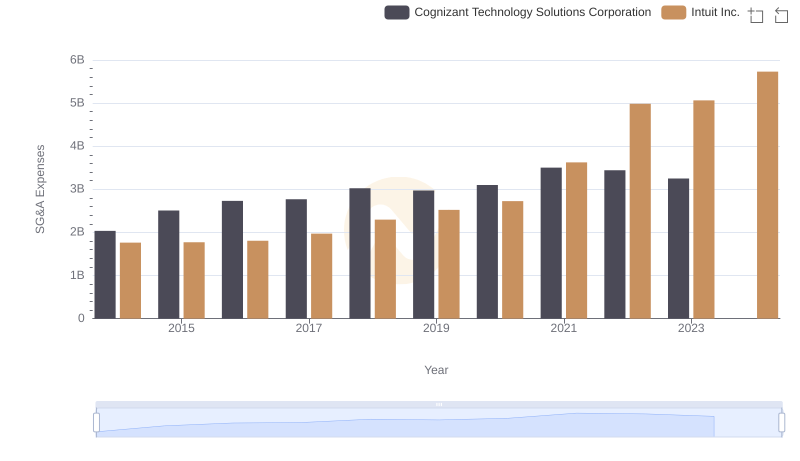
Cost Management Insights: SG&A Expenses for Intuit Inc. and Cognizant Technology Solutions Corporation
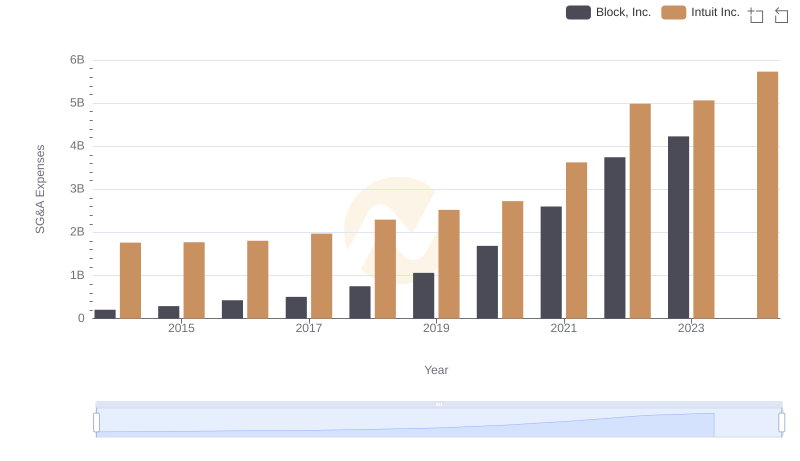
Intuit Inc. vs Block, Inc.: SG&A Expense Trends