| __timestamp | Intuit Inc. | TE Connectivity Ltd. |
|---|---|---|
| Wednesday, January 1, 2014 | 3838000000 | 4692000000 |
| Thursday, January 1, 2015 | 3467000000 | 4087000000 |
| Friday, January 1, 2016 | 3942000000 | 4033000000 |
| Sunday, January 1, 2017 | 4368000000 | 4450000000 |
| Monday, January 1, 2018 | 4987000000 | 4745000000 |
| Tuesday, January 1, 2019 | 5617000000 | 4394000000 |
| Wednesday, January 1, 2020 | 6301000000 | 3735000000 |
| Friday, January 1, 2021 | 7950000000 | 4887000000 |
| Saturday, January 1, 2022 | 10320000000 | 5244000000 |
| Sunday, January 1, 2023 | 11225000000 | 5055000000 |
| Monday, January 1, 2024 | 12820000000 | 5456000000 |
Data in motion
In the ever-evolving landscape of technology and connectivity, Intuit Inc. and TE Connectivity Ltd. have showcased remarkable financial trajectories over the past decade. From 2014 to 2024, Intuit Inc. has seen its gross profit soar by approximately 234%, reflecting its robust growth and strategic market positioning. In contrast, TE Connectivity Ltd. has experienced a more modest increase of around 16%, indicating steady, albeit slower, progress.
Intuit's impressive climb, particularly from 2020 onwards, highlights its adaptability and innovation in financial software solutions. Meanwhile, TE Connectivity's consistent performance underscores its resilience in the face of global challenges. As we look to the future, these trends offer valuable insights into the competitive dynamics of the tech industry, where agility and foresight are key to sustained success.
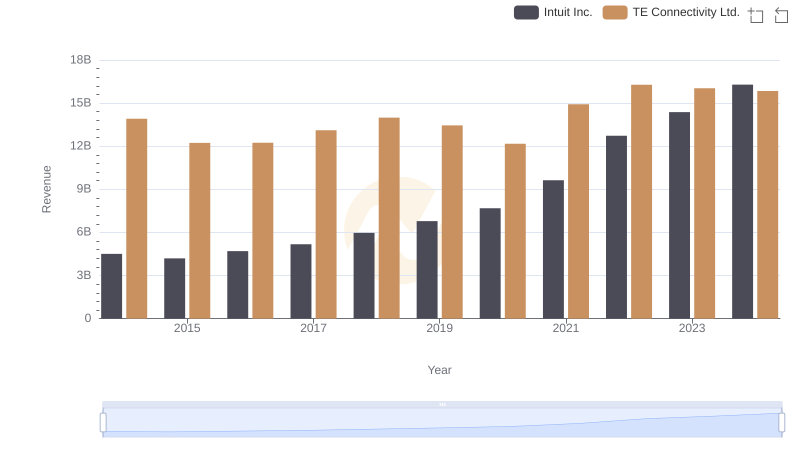
Annual Revenue Comparison: Intuit Inc. vs TE Connectivity Ltd.
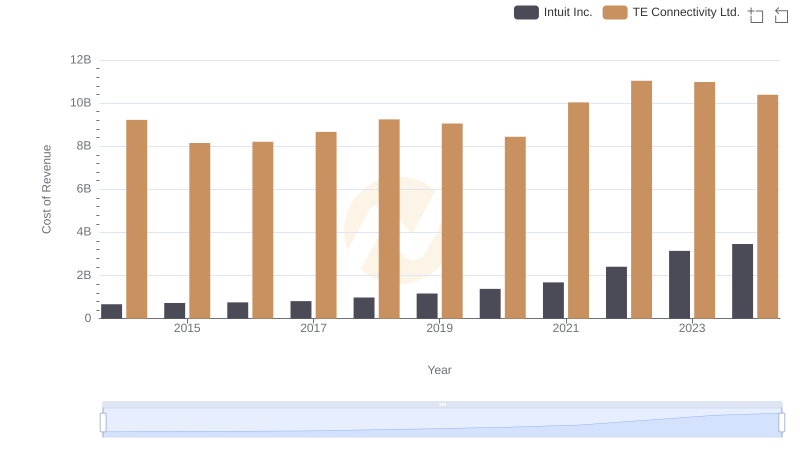
Cost of Revenue: Key Insights for Intuit Inc. and TE Connectivity Ltd.
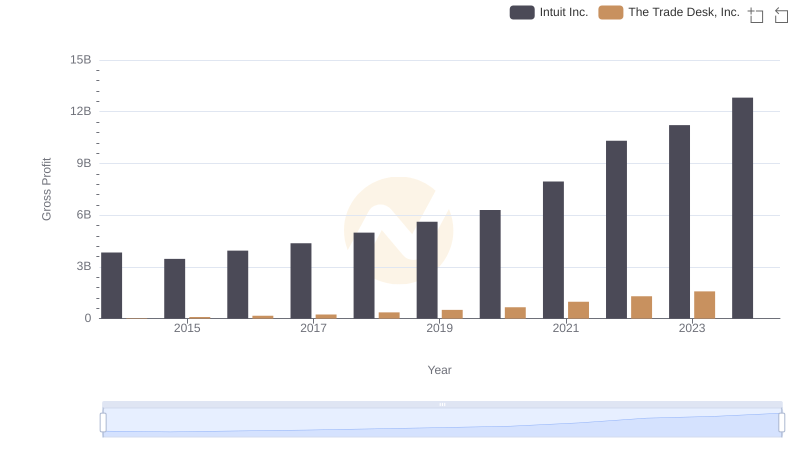
Gross Profit Comparison: Intuit Inc. and The Trade Desk, Inc. Trends
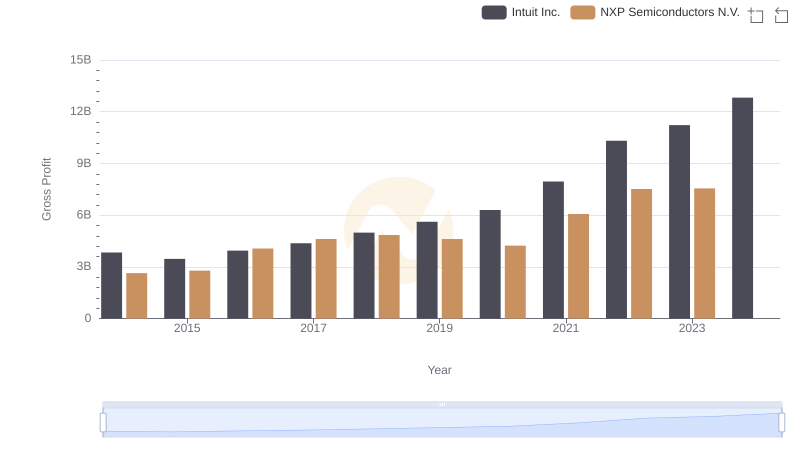
Gross Profit Trends Compared: Intuit Inc. vs NXP Semiconductors N.V.
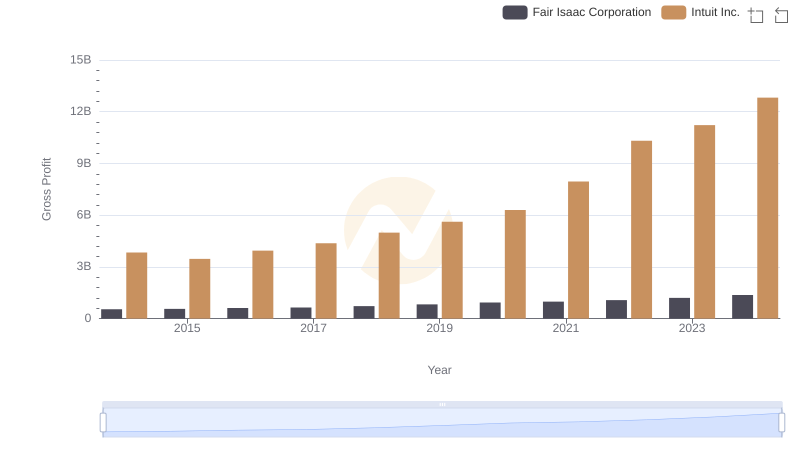
Intuit Inc. and Fair Isaac Corporation: A Detailed Gross Profit Analysis
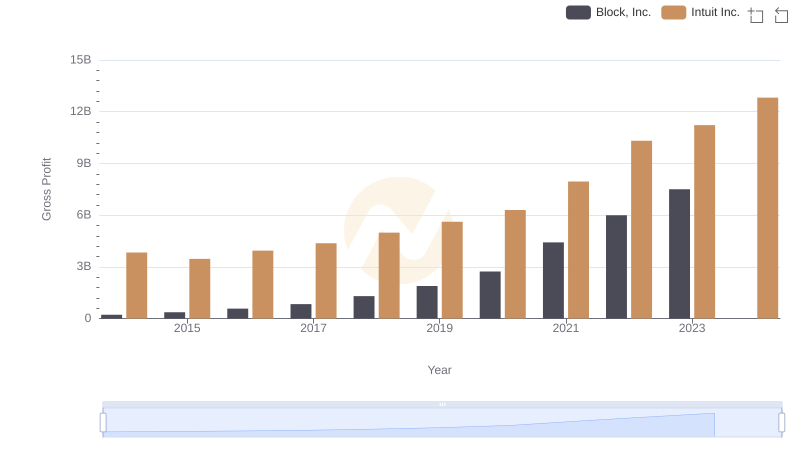
Gross Profit Comparison: Intuit Inc. and Block, Inc. Trends
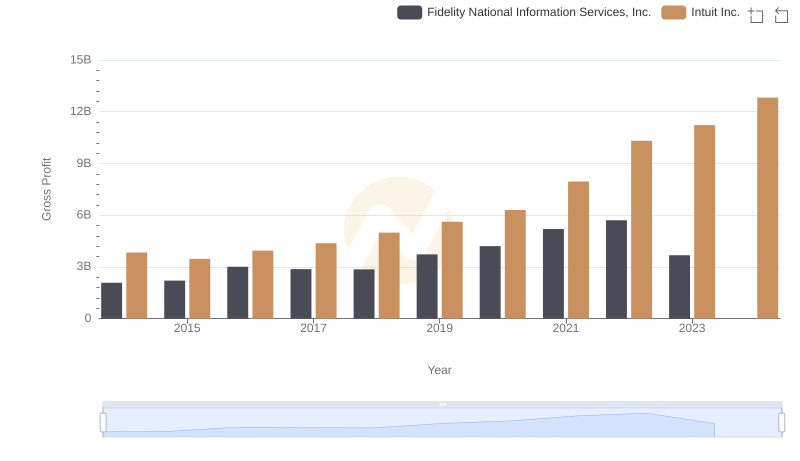
Gross Profit Analysis: Comparing Intuit Inc. and Fidelity National Information Services, Inc.
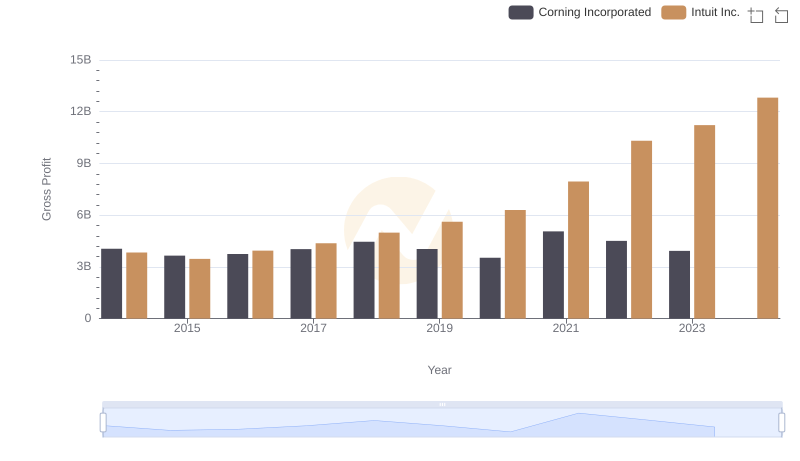
Gross Profit Trends Compared: Intuit Inc. vs Corning Incorporated
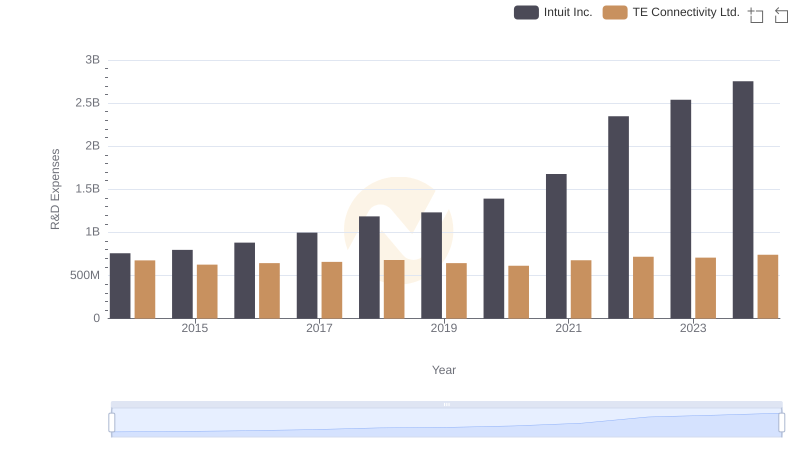
Intuit Inc. or TE Connectivity Ltd.: Who Invests More in Innovation?
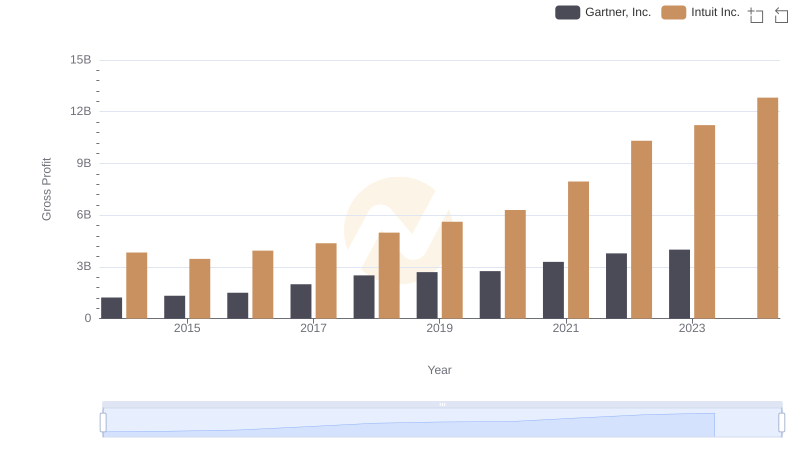
Who Generates Higher Gross Profit? Intuit Inc. or Gartner, Inc.
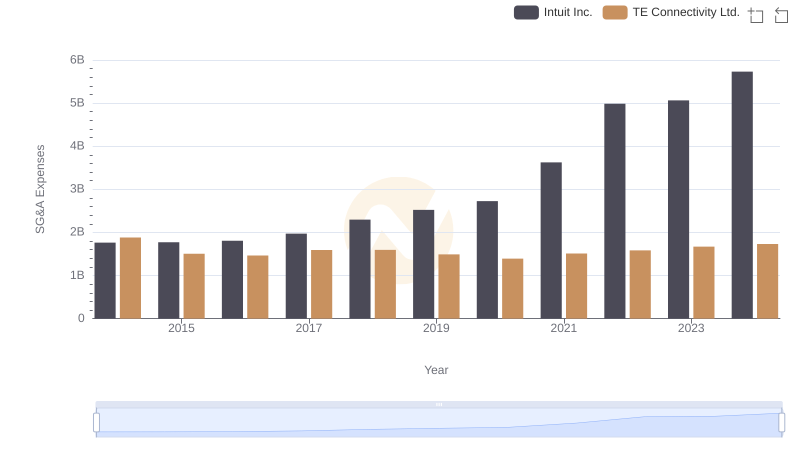
Cost Management Insights: SG&A Expenses for Intuit Inc. and TE Connectivity Ltd.
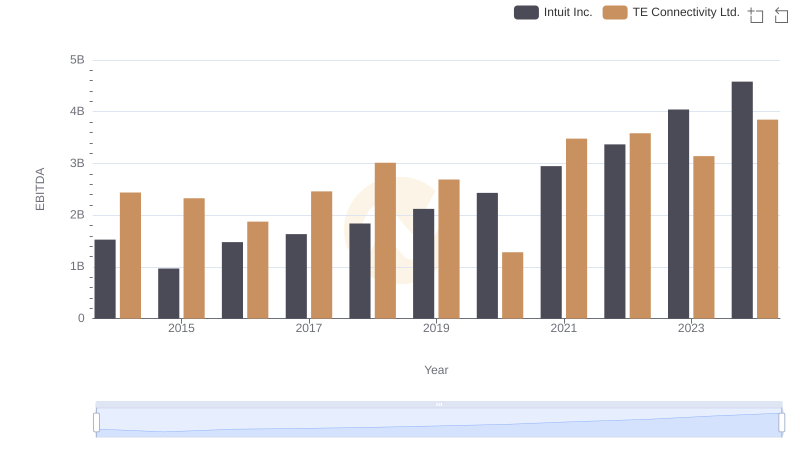
Intuit Inc. vs TE Connectivity Ltd.: In-Depth EBITDA Performance Comparison