| __timestamp | Intuit Inc. | TE Connectivity Ltd. |
|---|---|---|
| Wednesday, January 1, 2014 | 4506000000 | 13912000000 |
| Thursday, January 1, 2015 | 4192000000 | 12233000000 |
| Friday, January 1, 2016 | 4694000000 | 12238000000 |
| Sunday, January 1, 2017 | 5177000000 | 13113000000 |
| Monday, January 1, 2018 | 5964000000 | 13988000000 |
| Tuesday, January 1, 2019 | 6784000000 | 13448000000 |
| Wednesday, January 1, 2020 | 7679000000 | 12172000000 |
| Friday, January 1, 2021 | 9633000000 | 14923000000 |
| Saturday, January 1, 2022 | 12726000000 | 16281000000 |
| Sunday, January 1, 2023 | 14368000000 | 16034000000 |
| Monday, January 1, 2024 | 16285000000 | 15845000000 |
Unveiling the hidden dimensions of data
In the ever-evolving landscape of technology and connectivity, Intuit Inc. and TE Connectivity Ltd. have emerged as industry leaders. Over the past decade, from 2014 to 2024, these giants have showcased impressive revenue trajectories. Intuit Inc., known for its financial software solutions, has seen its revenue soar by approximately 260%, starting from $4.5 billion in 2014 to an estimated $16.3 billion in 2024. This growth reflects Intuit's strategic expansion and innovation in the fintech space.
Meanwhile, TE Connectivity Ltd., a leader in connectivity and sensor solutions, has maintained a steady revenue increase of around 14% over the same period, reaching $15.8 billion in 2024. This stability underscores TE Connectivity's resilience and adaptability in a competitive market. As we look to the future, these companies continue to set benchmarks in their respective fields, driving technological advancements and economic growth.
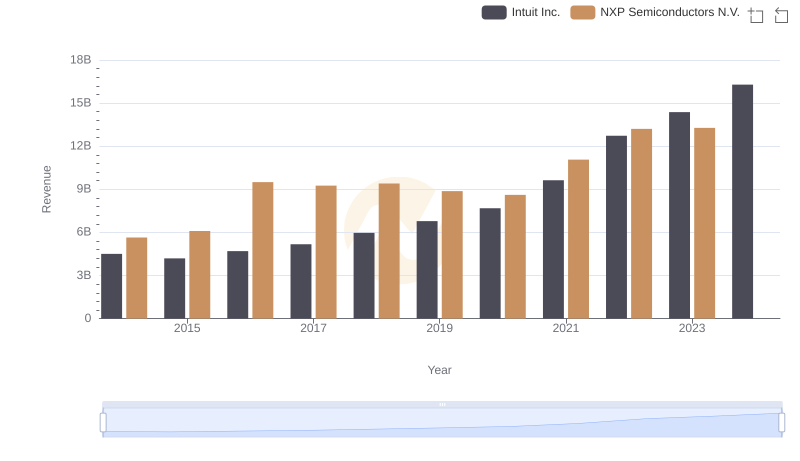
Intuit Inc. and NXP Semiconductors N.V.: A Comprehensive Revenue Analysis
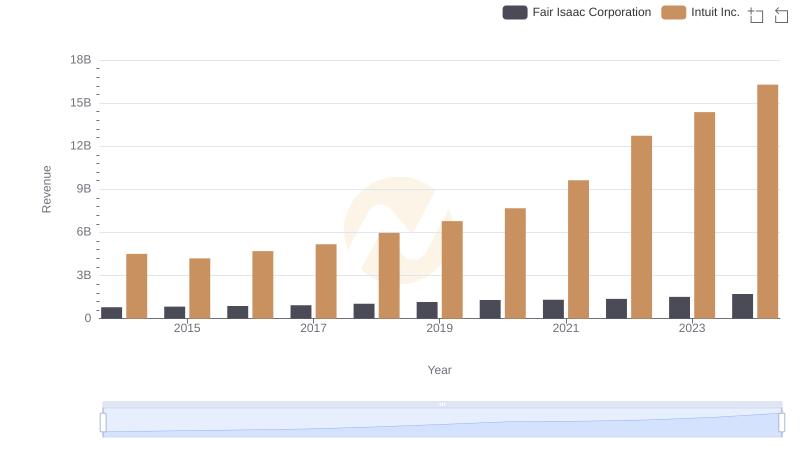
Revenue Insights: Intuit Inc. and Fair Isaac Corporation Performance Compared
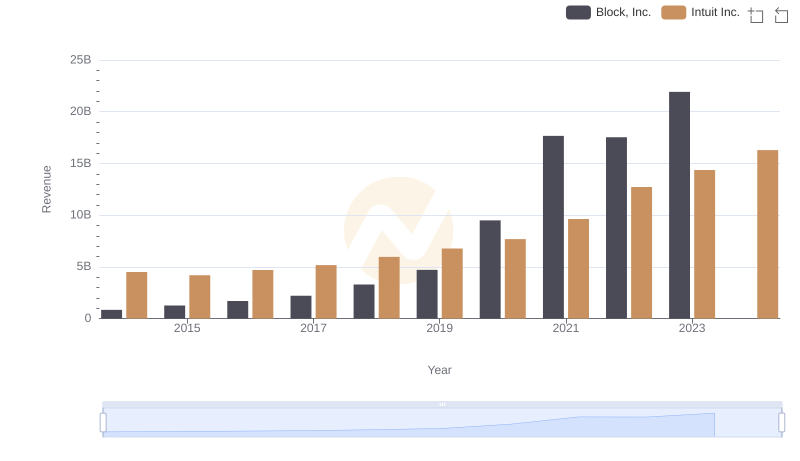
Breaking Down Revenue Trends: Intuit Inc. vs Block, Inc.
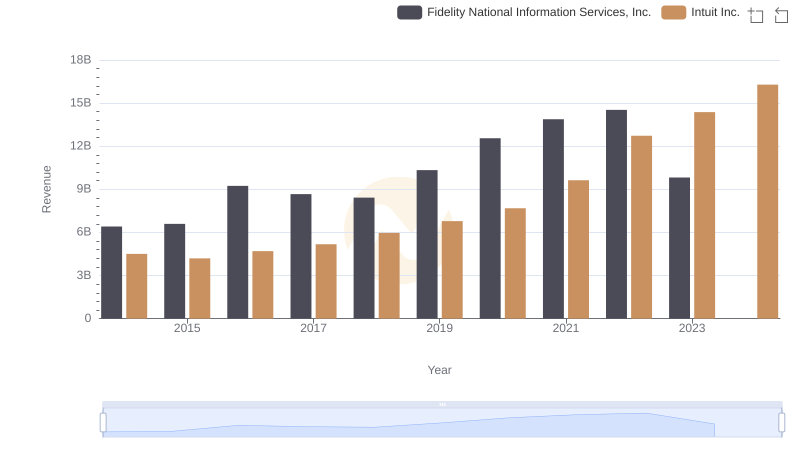
Revenue Insights: Intuit Inc. and Fidelity National Information Services, Inc. Performance Compared
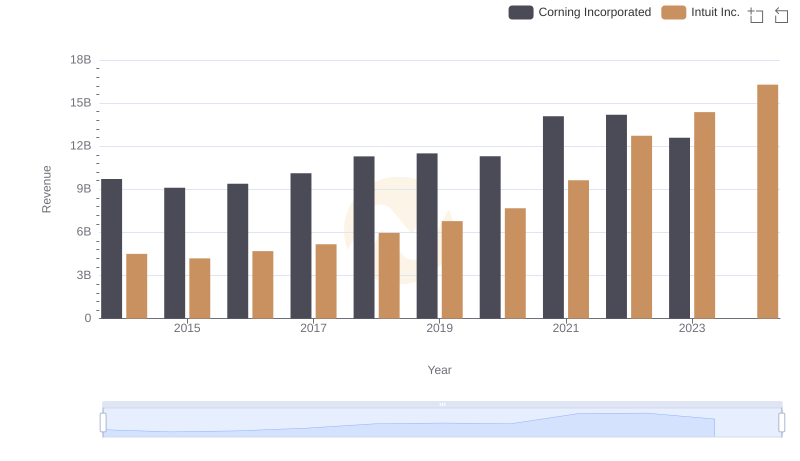
Intuit Inc. vs Corning Incorporated: Examining Key Revenue Metrics
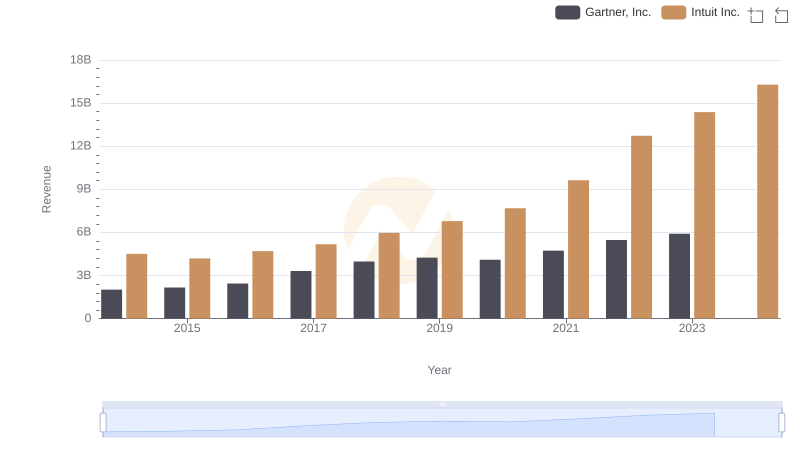
Intuit Inc. and Gartner, Inc.: A Comprehensive Revenue Analysis
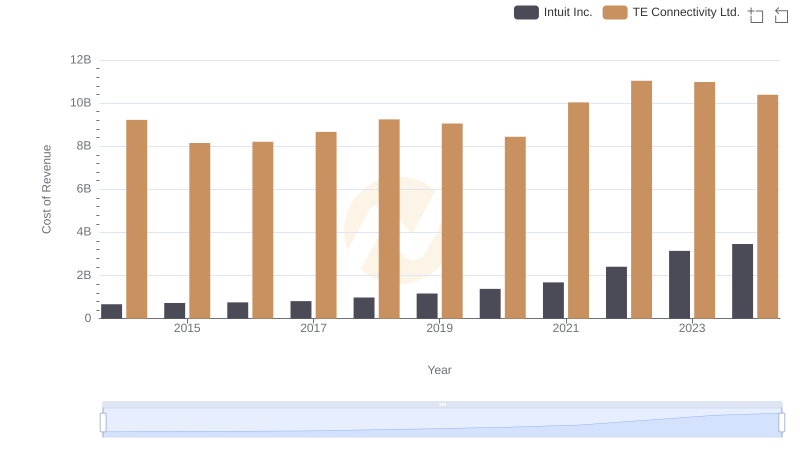
Cost of Revenue: Key Insights for Intuit Inc. and TE Connectivity Ltd.
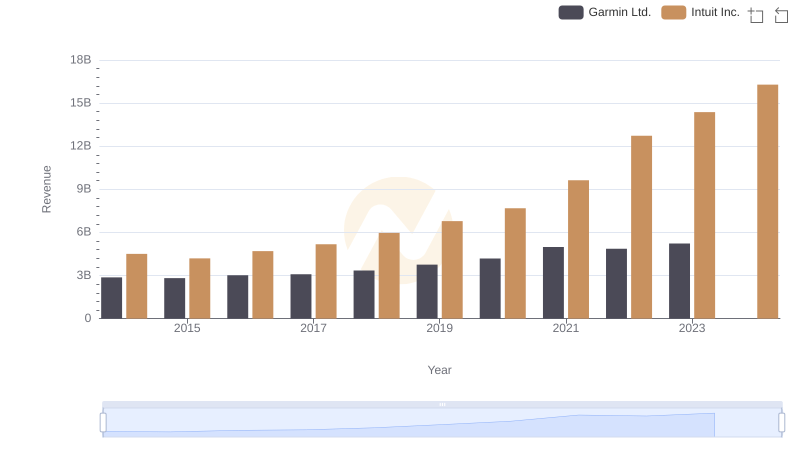
Revenue Showdown: Intuit Inc. vs Garmin Ltd.
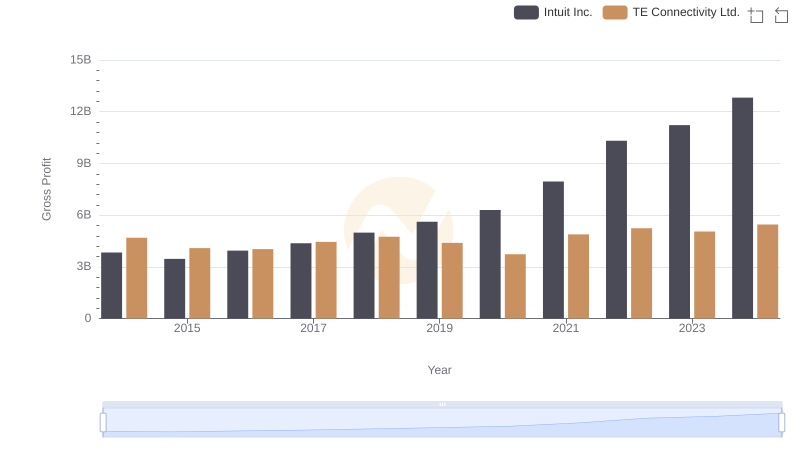
Intuit Inc. vs TE Connectivity Ltd.: A Gross Profit Performance Breakdown
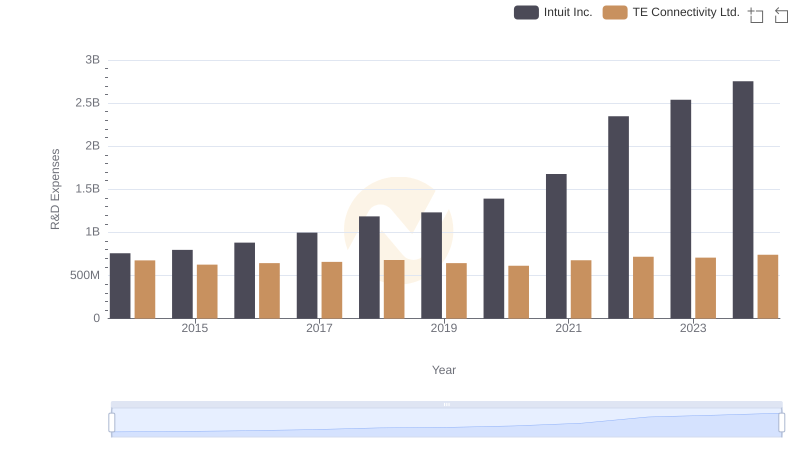
Intuit Inc. or TE Connectivity Ltd.: Who Invests More in Innovation?
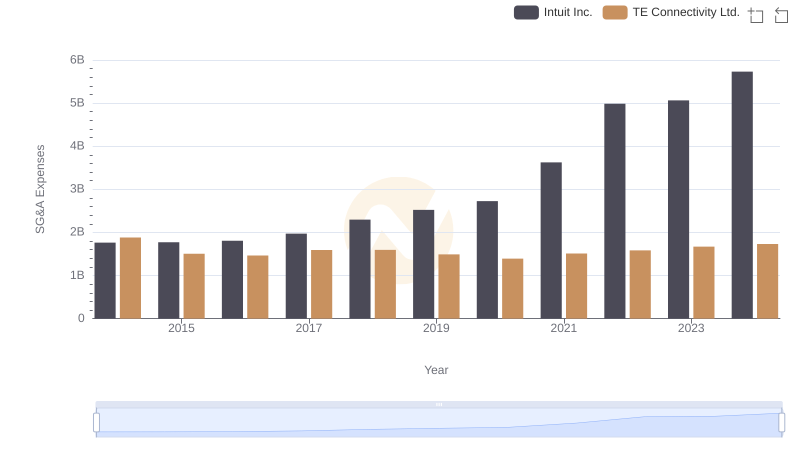
Cost Management Insights: SG&A Expenses for Intuit Inc. and TE Connectivity Ltd.
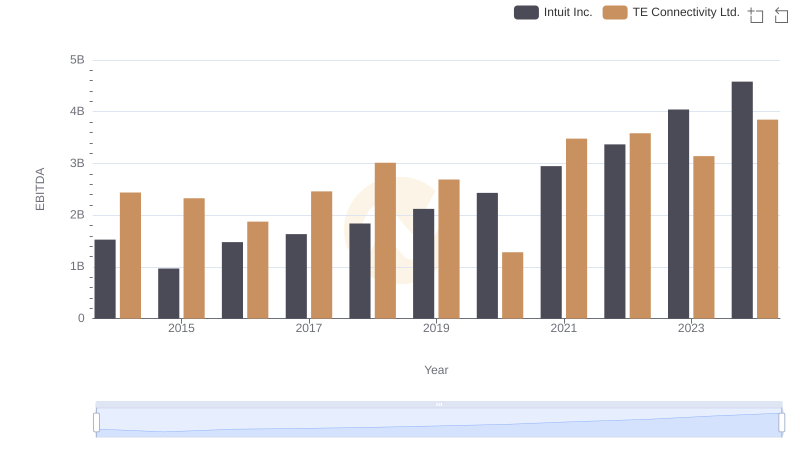
Intuit Inc. vs TE Connectivity Ltd.: In-Depth EBITDA Performance Comparison