| __timestamp | Intel Corporation | Intuit Inc. |
|---|---|---|
| Wednesday, January 1, 2014 | 8136000000 | 1762000000 |
| Thursday, January 1, 2015 | 7930000000 | 1771000000 |
| Friday, January 1, 2016 | 8397000000 | 1807000000 |
| Sunday, January 1, 2017 | 7474000000 | 1973000000 |
| Monday, January 1, 2018 | 6750000000 | 2298000000 |
| Tuesday, January 1, 2019 | 6150000000 | 2524000000 |
| Wednesday, January 1, 2020 | 6180000000 | 2727000000 |
| Friday, January 1, 2021 | 6543000000 | 3626000000 |
| Saturday, January 1, 2022 | 7002000000 | 4986000000 |
| Sunday, January 1, 2023 | 5634000000 | 5062000000 |
| Monday, January 1, 2024 | 5507000000 | 5730000000 |
Unleashing the power of data
In the ever-evolving landscape of corporate finance, understanding the spending patterns of industry giants like Intuit Inc. and Intel Corporation offers valuable insights. Over the past decade, from 2014 to 2023, these two companies have demonstrated distinct approaches to their Selling, General, and Administrative (SG&A) expenses.
Intel Corporation, a leader in semiconductor manufacturing, has seen its SG&A expenses fluctuate, peaking in 2016 and gradually declining by 33% by 2023. This trend reflects Intel's strategic cost management in response to market dynamics. In contrast, Intuit Inc., renowned for its financial software, has consistently increased its SG&A spending, more than doubling from 2014 to 2023. This growth underscores Intuit's commitment to expanding its market presence and enhancing customer engagement.
While the data for 2024 is incomplete, the trends observed provide a compelling narrative of strategic financial management in the tech industry.
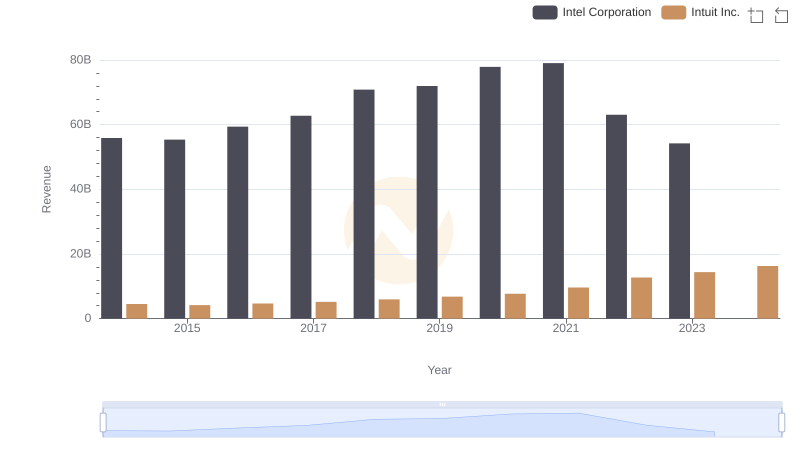
Breaking Down Revenue Trends: Intuit Inc. vs Intel Corporation
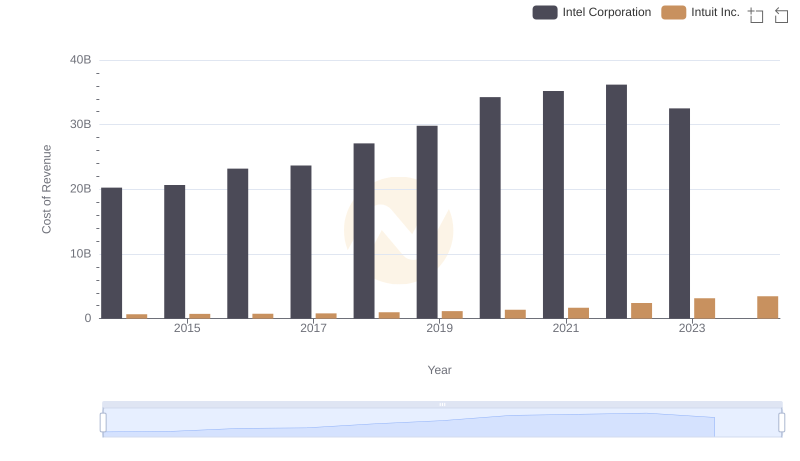
Intuit Inc. vs Intel Corporation: Efficiency in Cost of Revenue Explored
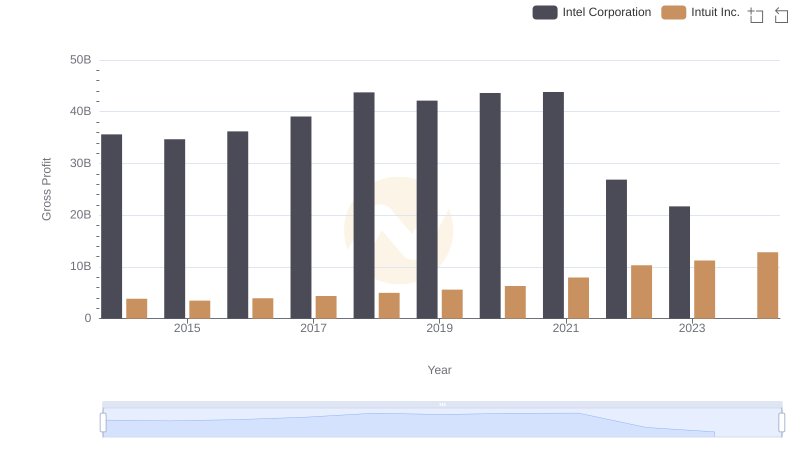
Intuit Inc. vs Intel Corporation: A Gross Profit Performance Breakdown
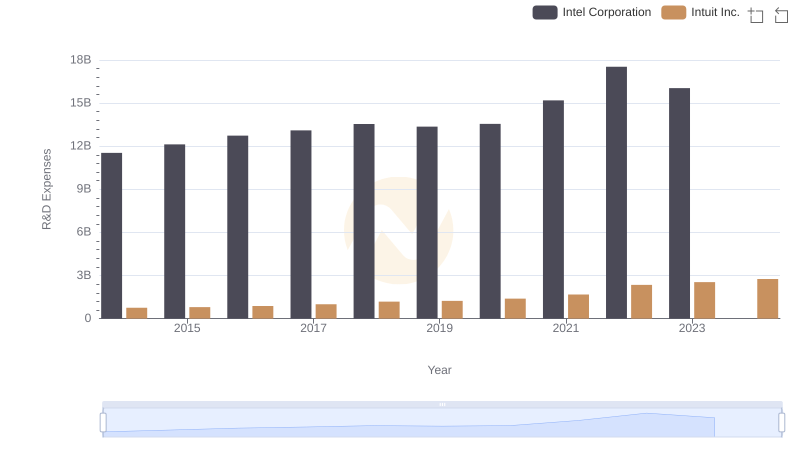
R&D Insights: How Intuit Inc. and Intel Corporation Allocate Funds
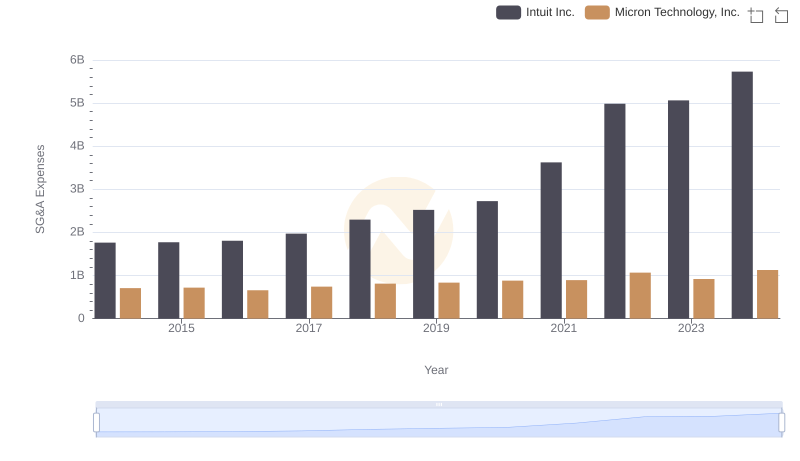
Who Optimizes SG&A Costs Better? Intuit Inc. or Micron Technology, Inc.
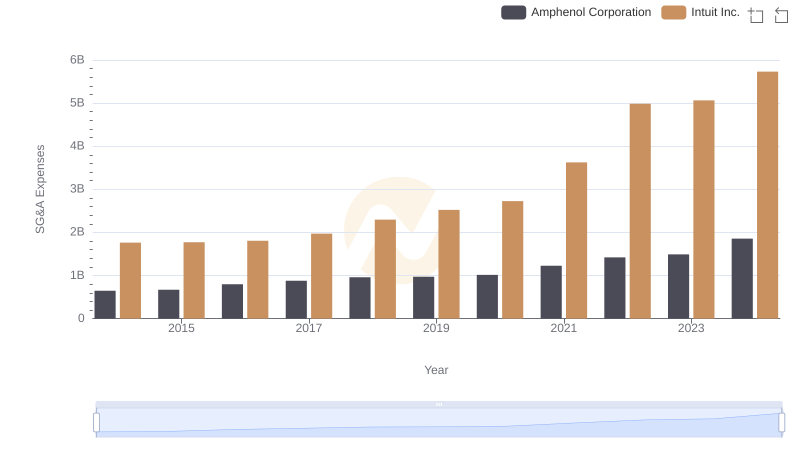
Who Optimizes SG&A Costs Better? Intuit Inc. or Amphenol Corporation
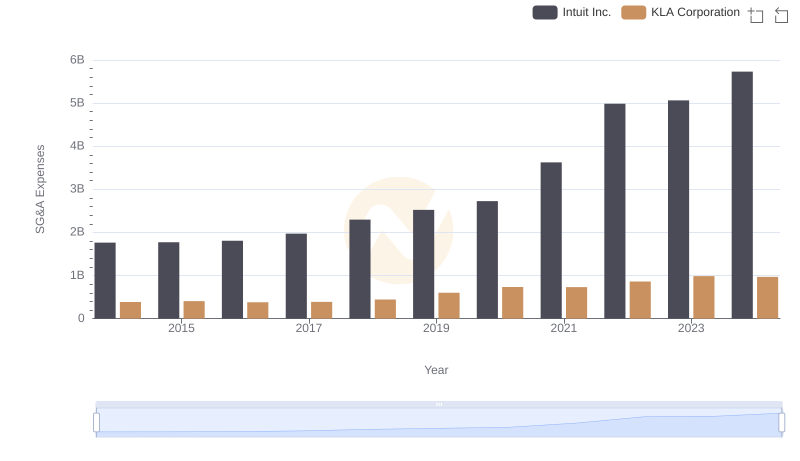
Intuit Inc. and KLA Corporation: SG&A Spending Patterns Compared
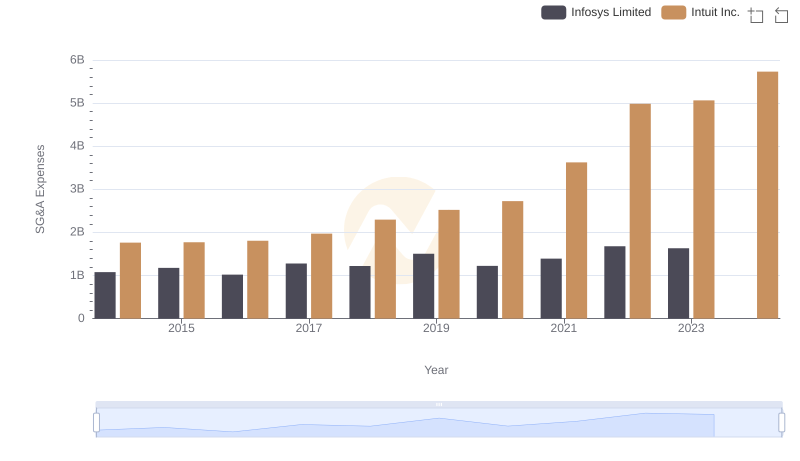
Intuit Inc. and Infosys Limited: SG&A Spending Patterns Compared
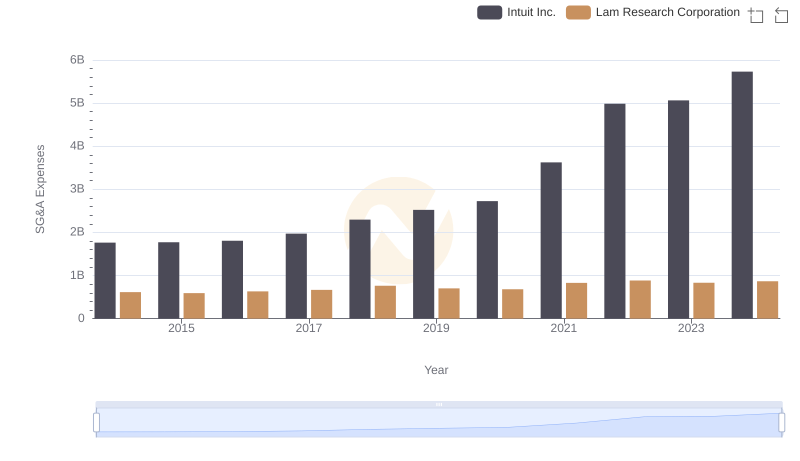
Comparing SG&A Expenses: Intuit Inc. vs Lam Research Corporation Trends and Insights
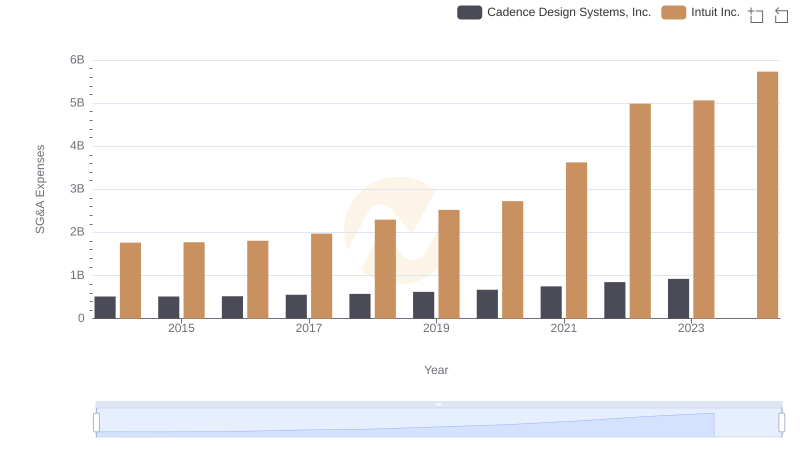
Operational Costs Compared: SG&A Analysis of Intuit Inc. and Cadence Design Systems, Inc.
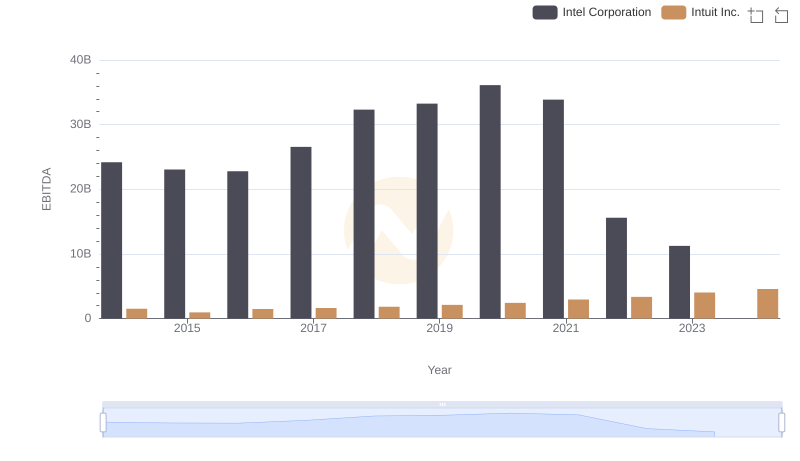
A Professional Review of EBITDA: Intuit Inc. Compared to Intel Corporation
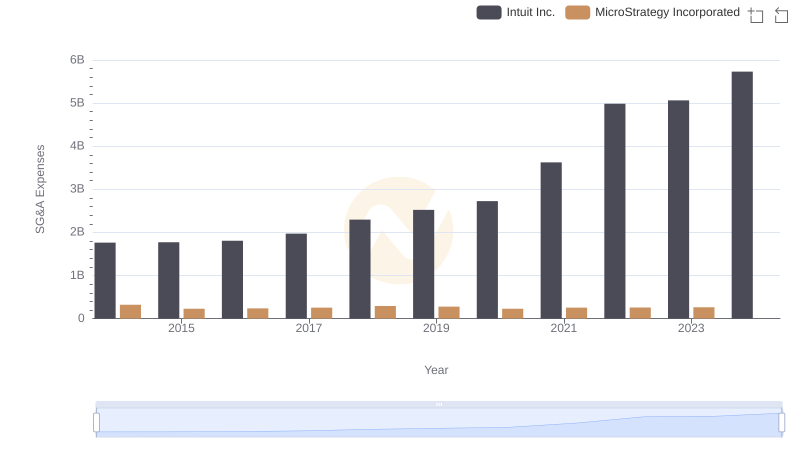
Intuit Inc. and MicroStrategy Incorporated: SG&A Spending Patterns Compared