| __timestamp | Intel Corporation | Intuit Inc. |
|---|---|---|
| Wednesday, January 1, 2014 | 35609000000 | 3838000000 |
| Thursday, January 1, 2015 | 34679000000 | 3467000000 |
| Friday, January 1, 2016 | 36191000000 | 3942000000 |
| Sunday, January 1, 2017 | 39069000000 | 4368000000 |
| Monday, January 1, 2018 | 43737000000 | 4987000000 |
| Tuesday, January 1, 2019 | 42140000000 | 5617000000 |
| Wednesday, January 1, 2020 | 43612000000 | 6301000000 |
| Friday, January 1, 2021 | 43815000000 | 7950000000 |
| Saturday, January 1, 2022 | 26866000000 | 10320000000 |
| Sunday, January 1, 2023 | 21711000000 | 11225000000 |
| Monday, January 1, 2024 | 17345000000 | 12820000000 |
Unlocking the unknown
In the ever-evolving landscape of technology, the financial performance of industry leaders like Intuit Inc. and Intel Corporation offers a fascinating glimpse into their strategic prowess. Over the past decade, Intel's gross profit has seen a rollercoaster ride, peaking in 2021 before a sharp decline of nearly 50% by 2023. Meanwhile, Intuit has steadily climbed, with a remarkable 192% increase from 2014 to 2023, showcasing its resilience and adaptability.
As we look to the future, these trends underscore the dynamic nature of the tech industry and the importance of strategic innovation.
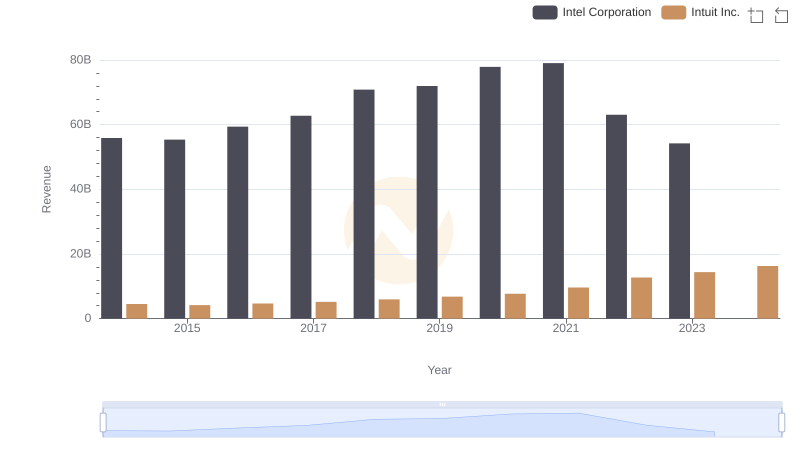
Breaking Down Revenue Trends: Intuit Inc. vs Intel Corporation
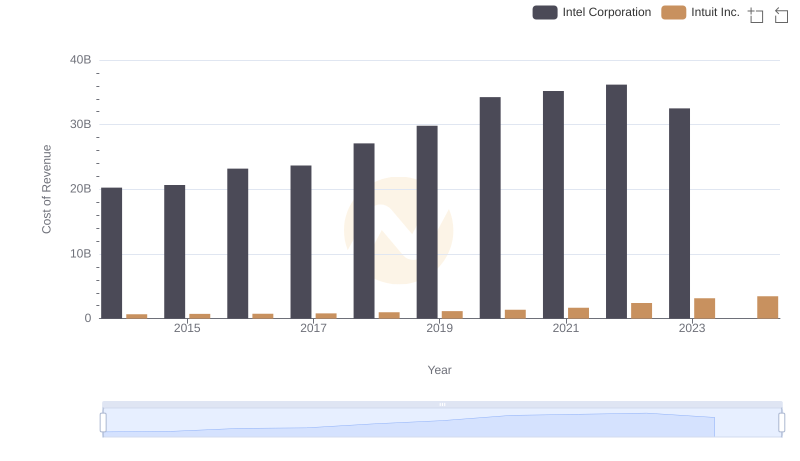
Intuit Inc. vs Intel Corporation: Efficiency in Cost of Revenue Explored
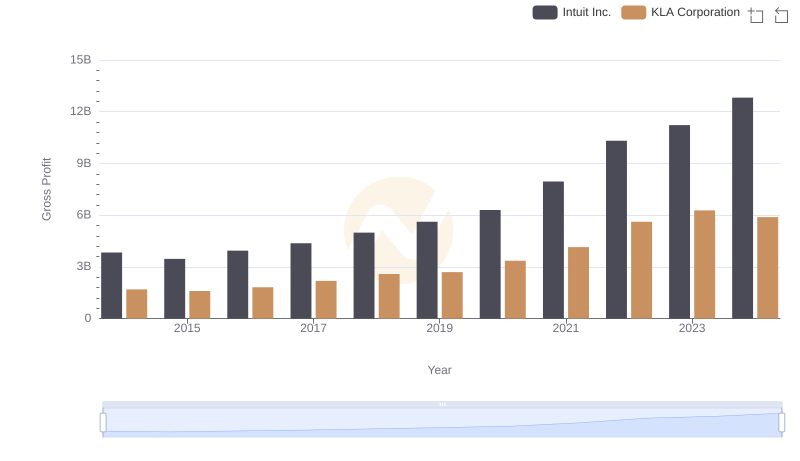
Intuit Inc. and KLA Corporation: A Detailed Gross Profit Analysis
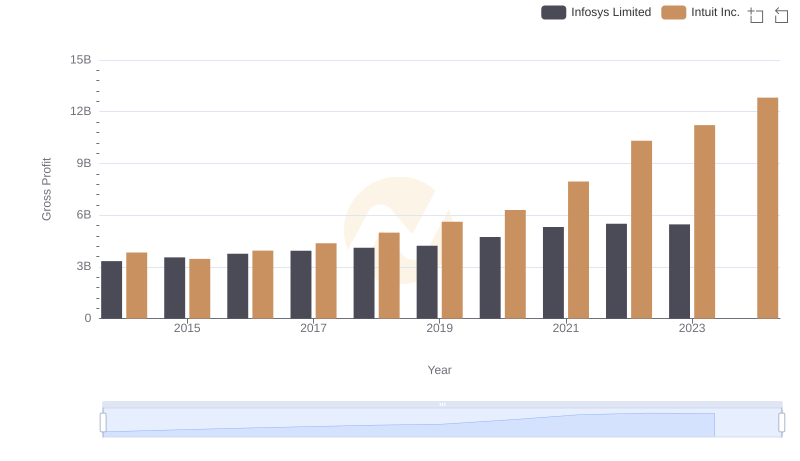
Gross Profit Trends Compared: Intuit Inc. vs Infosys Limited
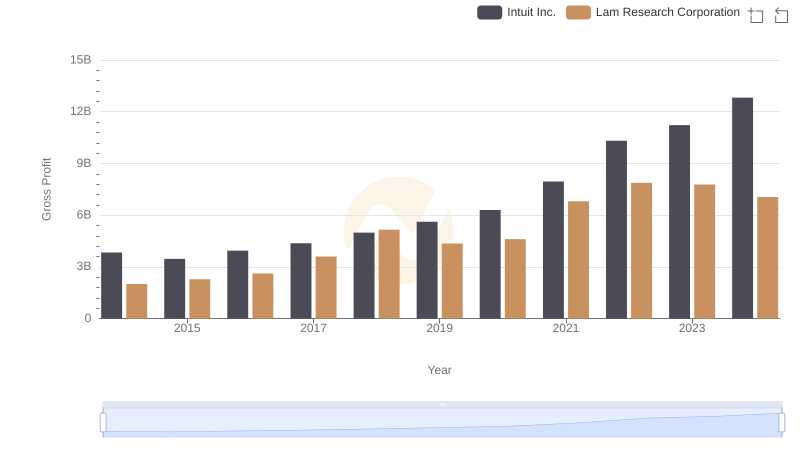
Gross Profit Comparison: Intuit Inc. and Lam Research Corporation Trends
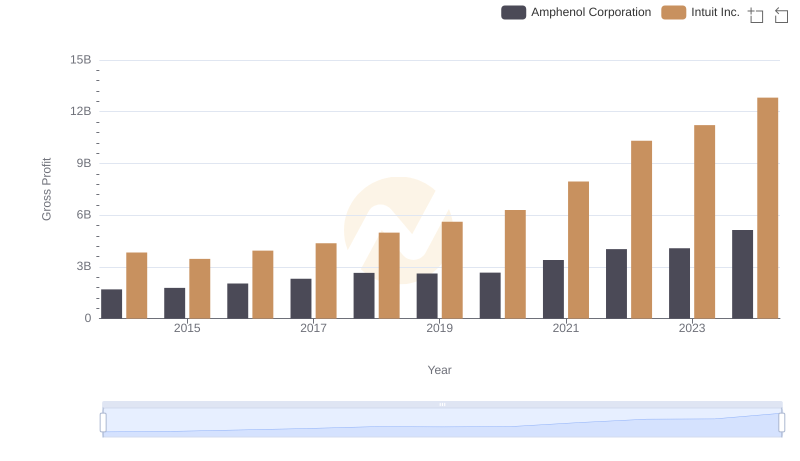
Gross Profit Analysis: Comparing Intuit Inc. and Amphenol Corporation
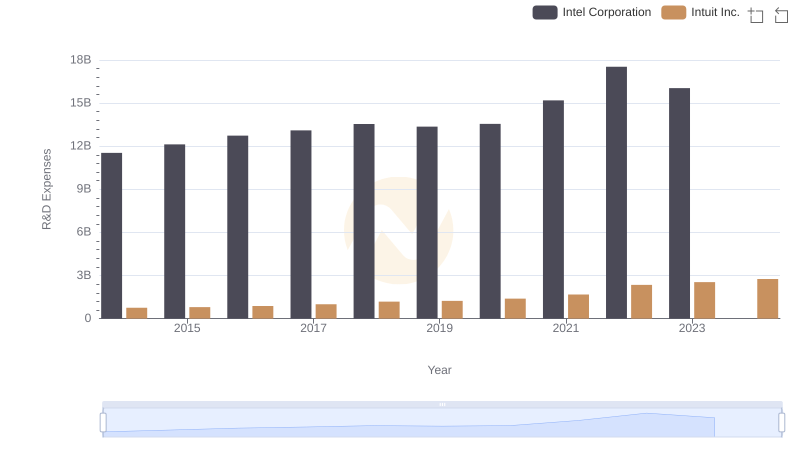
R&D Insights: How Intuit Inc. and Intel Corporation Allocate Funds
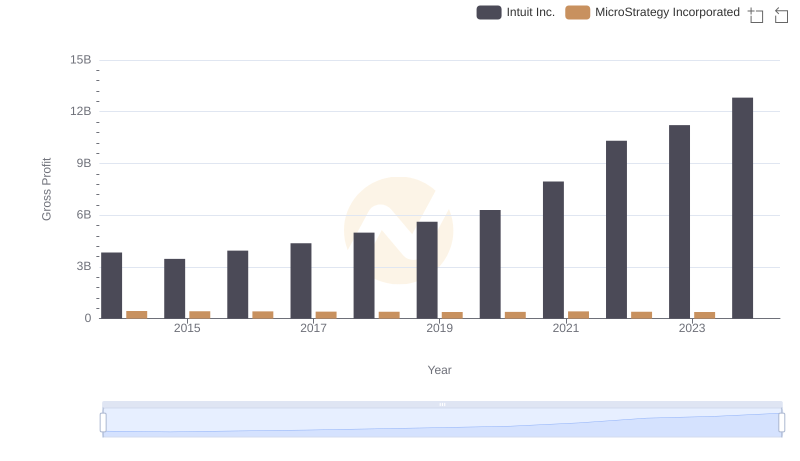
Gross Profit Comparison: Intuit Inc. and MicroStrategy Incorporated Trends
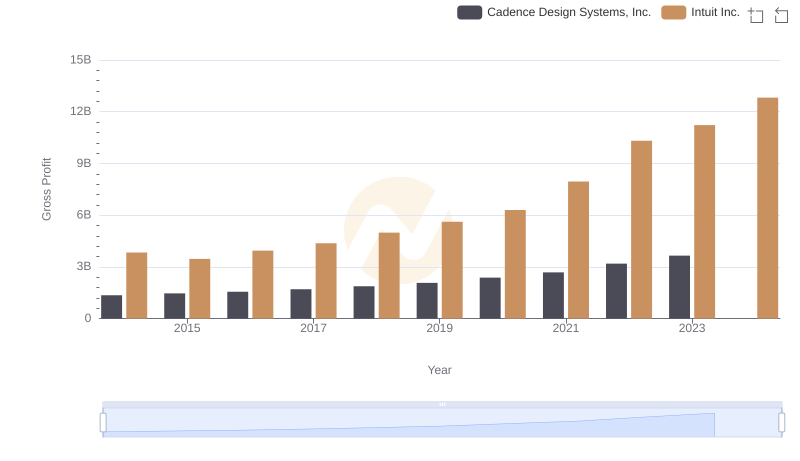
Key Insights on Gross Profit: Intuit Inc. vs Cadence Design Systems, Inc.
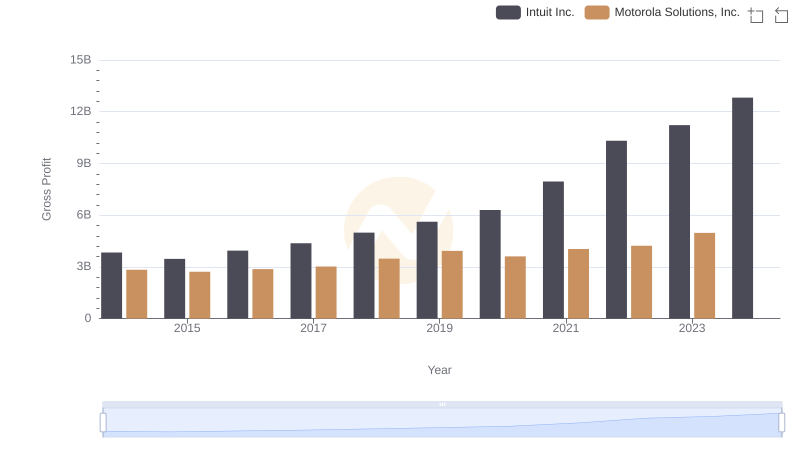
Intuit Inc. and Motorola Solutions, Inc.: A Detailed Gross Profit Analysis
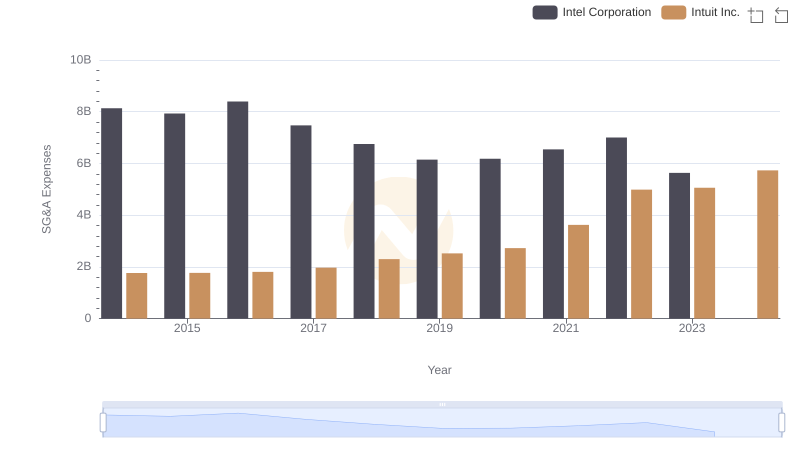
Intuit Inc. and Intel Corporation: SG&A Spending Patterns Compared
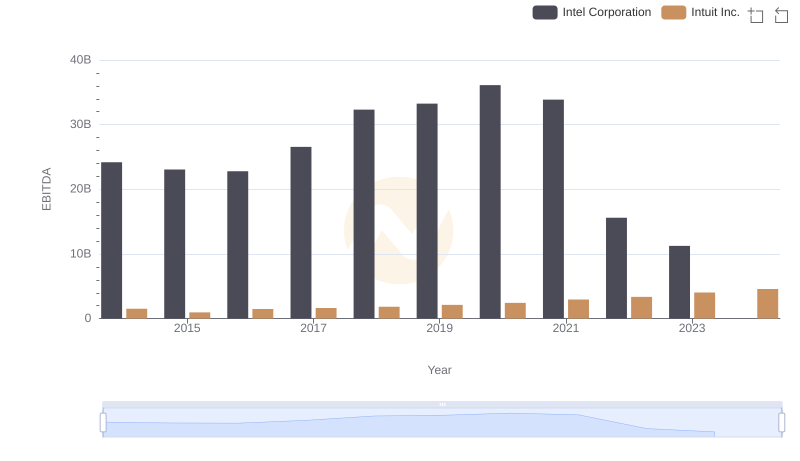
A Professional Review of EBITDA: Intuit Inc. Compared to Intel Corporation