| __timestamp | Intel Corporation | Intuit Inc. |
|---|---|---|
| Wednesday, January 1, 2014 | 24191000000 | 1528000000 |
| Thursday, January 1, 2015 | 23067000000 | 970000000 |
| Friday, January 1, 2016 | 22795000000 | 1480000000 |
| Sunday, January 1, 2017 | 26563000000 | 1634000000 |
| Monday, January 1, 2018 | 32329000000 | 1839000000 |
| Tuesday, January 1, 2019 | 33254000000 | 2121000000 |
| Wednesday, January 1, 2020 | 36115000000 | 2430000000 |
| Friday, January 1, 2021 | 33874000000 | 2948000000 |
| Saturday, January 1, 2022 | 15610000000 | 3369000000 |
| Sunday, January 1, 2023 | 11242000000 | 4043000000 |
| Monday, January 1, 2024 | 1203000000 | 4581000000 |
Cracking the code
In the ever-evolving landscape of technology, financial performance is a key indicator of a company's resilience and growth. Over the past decade, Intuit Inc. and Intel Corporation have showcased contrasting EBITDA trajectories. From 2014 to 2023, Intel's EBITDA peaked in 2020, reaching nearly 36% above its 2014 levels, before experiencing a significant decline of over 50% by 2023. In contrast, Intuit Inc. demonstrated a steady upward trend, with its EBITDA growing by approximately 165% from 2014 to 2023. This divergence highlights Intuit's robust growth strategy and adaptability in a competitive market, while Intel faced challenges that impacted its financial performance. Notably, data for Intel in 2024 is missing, leaving room for speculation on its future trajectory. As we look ahead, these insights provide a compelling narrative of strategic shifts and market dynamics in the tech industry.
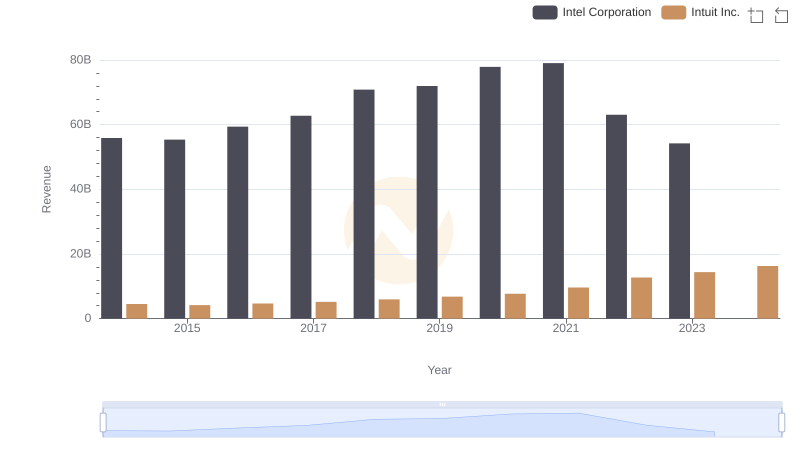
Breaking Down Revenue Trends: Intuit Inc. vs Intel Corporation
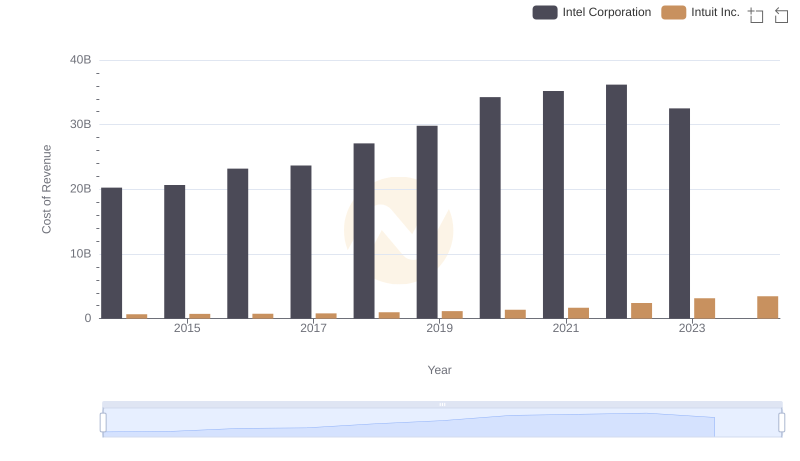
Intuit Inc. vs Intel Corporation: Efficiency in Cost of Revenue Explored
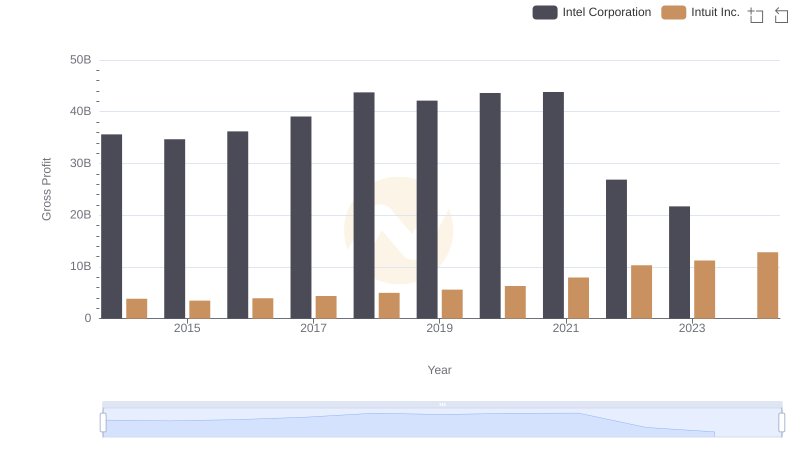
Intuit Inc. vs Intel Corporation: A Gross Profit Performance Breakdown
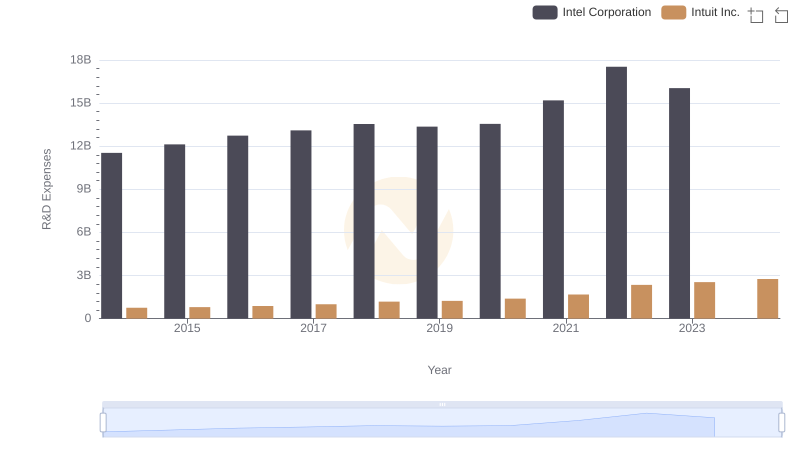
R&D Insights: How Intuit Inc. and Intel Corporation Allocate Funds
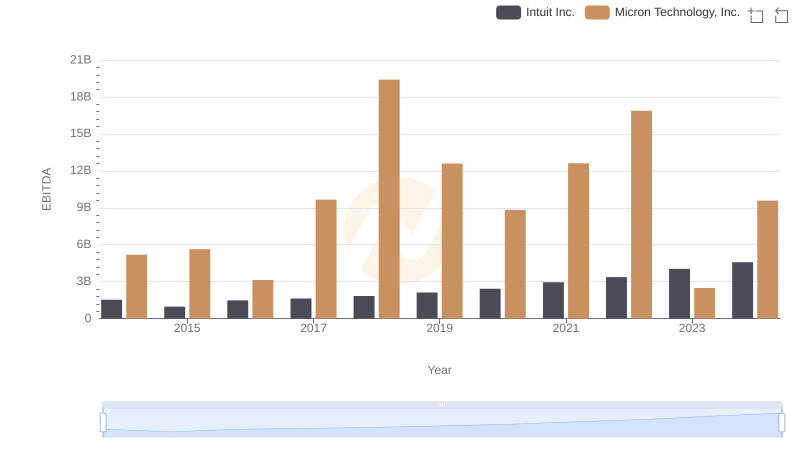
A Side-by-Side Analysis of EBITDA: Intuit Inc. and Micron Technology, Inc.
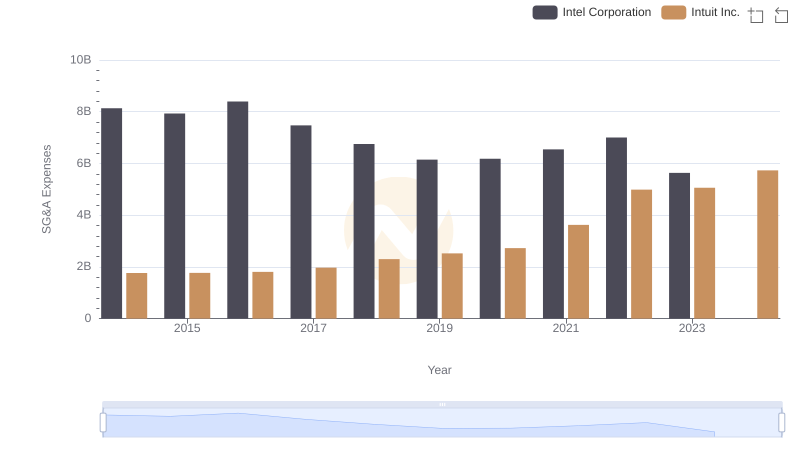
Intuit Inc. and Intel Corporation: SG&A Spending Patterns Compared
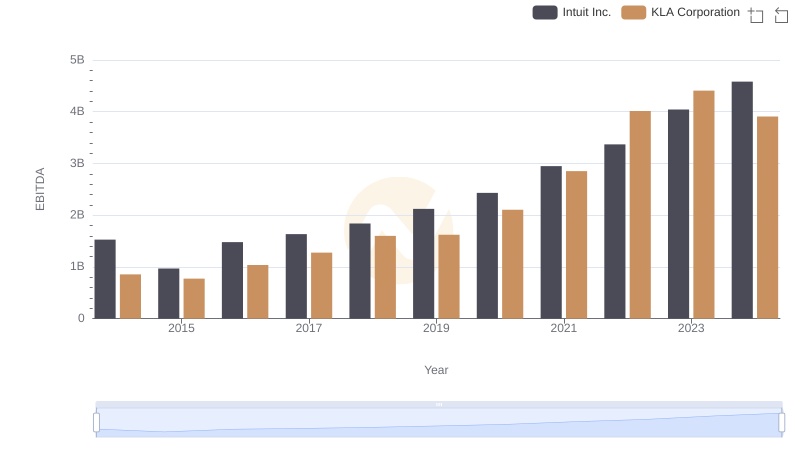
Intuit Inc. vs KLA Corporation: In-Depth EBITDA Performance Comparison
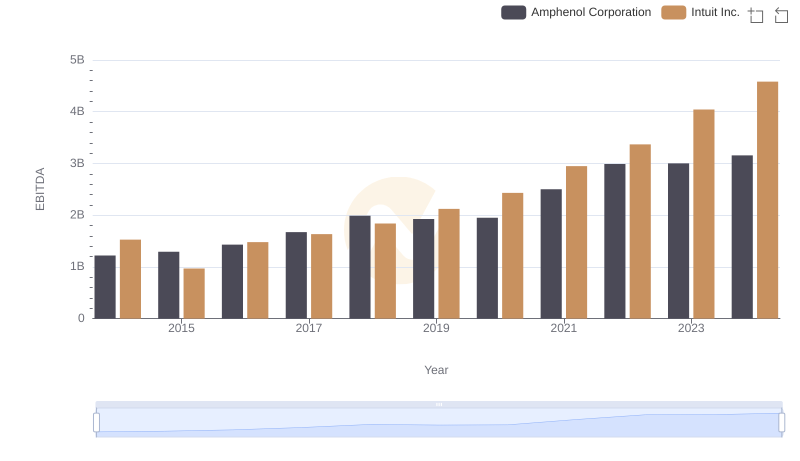
A Side-by-Side Analysis of EBITDA: Intuit Inc. and Amphenol Corporation
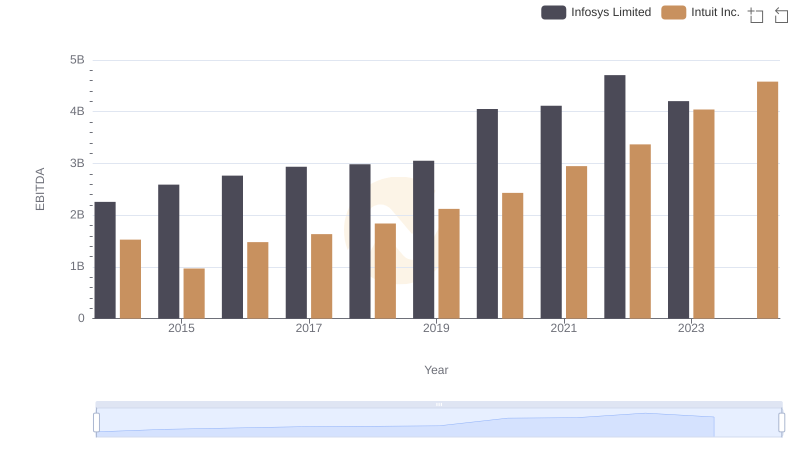
Intuit Inc. and Infosys Limited: A Detailed Examination of EBITDA Performance
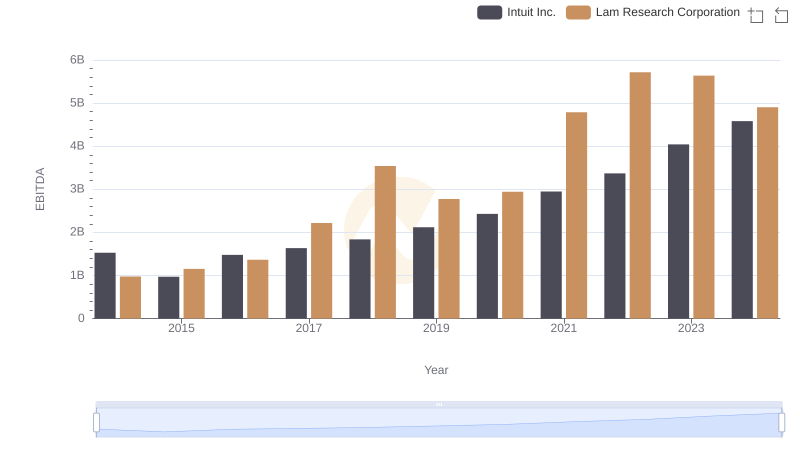
Intuit Inc. and Lam Research Corporation: A Detailed Examination of EBITDA Performance
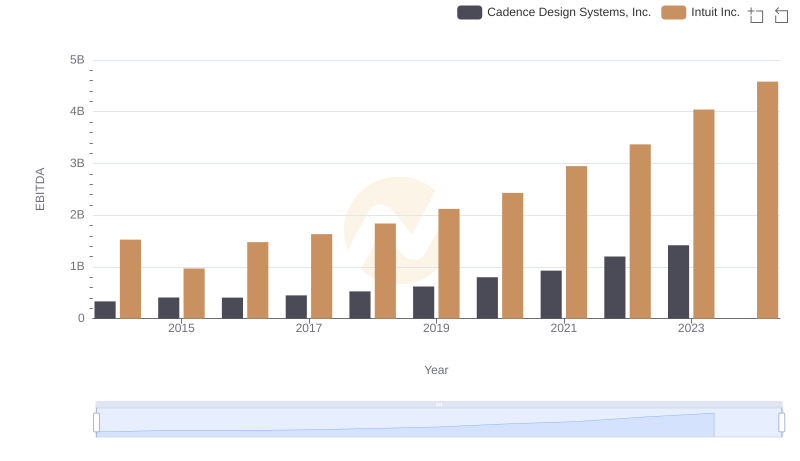
Comparative EBITDA Analysis: Intuit Inc. vs Cadence Design Systems, Inc.
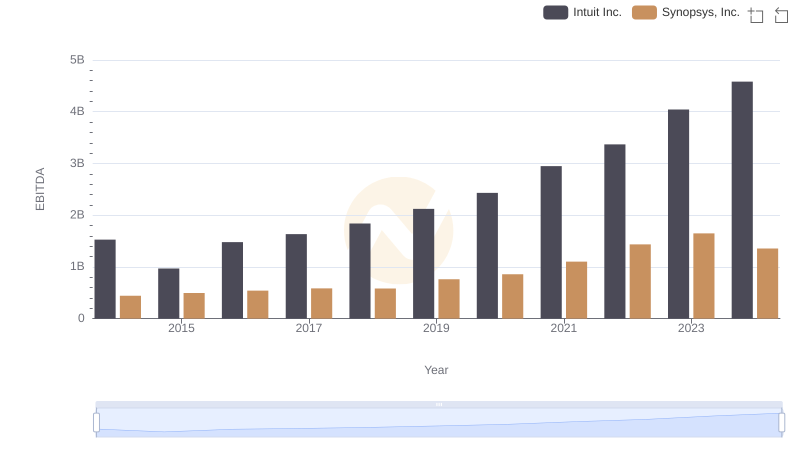
EBITDA Analysis: Evaluating Intuit Inc. Against Synopsys, Inc.