| __timestamp | Intuit Inc. | MicroStrategy Incorporated |
|---|---|---|
| Wednesday, January 1, 2014 | 1762000000 | 321429000 |
| Thursday, January 1, 2015 | 1771000000 | 229254000 |
| Friday, January 1, 2016 | 1807000000 | 238202000 |
| Sunday, January 1, 2017 | 1973000000 | 254773000 |
| Monday, January 1, 2018 | 2298000000 | 291659000 |
| Tuesday, January 1, 2019 | 2524000000 | 277932000 |
| Wednesday, January 1, 2020 | 2727000000 | 229046000 |
| Friday, January 1, 2021 | 3626000000 | 255642000 |
| Saturday, January 1, 2022 | 4986000000 | 258303000 |
| Sunday, January 1, 2023 | 5062000000 | 264983000 |
| Monday, January 1, 2024 | 5730000000 | 278618000 |
Unlocking the unknown
In the world of corporate finance, understanding a company's spending patterns can reveal much about its strategic priorities. Over the past decade, Intuit Inc. and MicroStrategy Incorporated have showcased contrasting approaches in their Selling, General, and Administrative (SG&A) expenses. Intuit's SG&A expenses have surged by over 225% from 2014 to 2023, reflecting its aggressive growth and expansion strategies. In contrast, MicroStrategy's SG&A expenses have remained relatively stable, with a modest increase of about 15% over the same period, indicating a more conservative financial approach.
This divergence highlights the different paths these companies have taken in navigating the competitive landscape. While Intuit's spending reflects its commitment to scaling operations and enhancing market presence, MicroStrategy's steady expenses suggest a focus on maintaining operational efficiency. As we look to the future, these spending patterns may offer insights into each company's evolving business strategies.
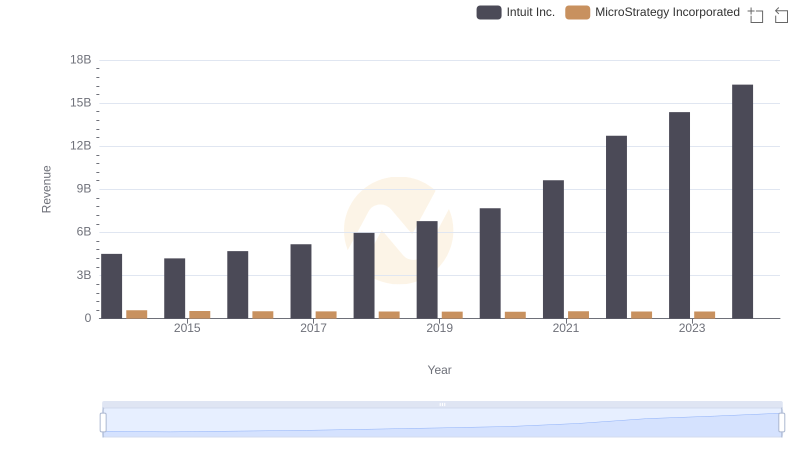
Revenue Showdown: Intuit Inc. vs MicroStrategy Incorporated
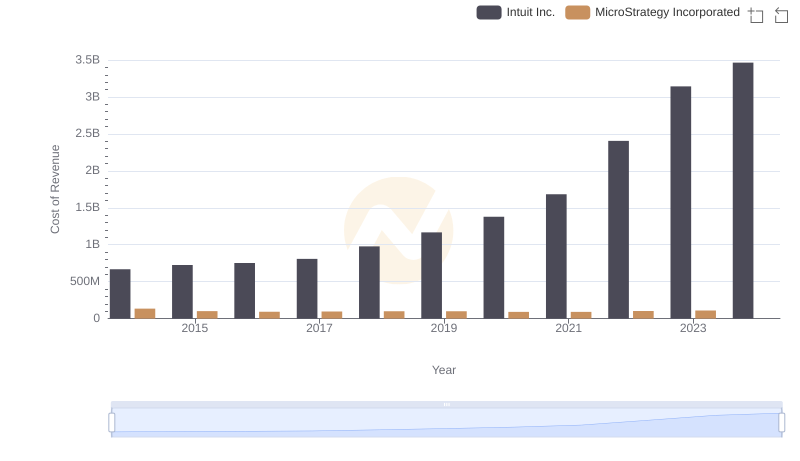
Analyzing Cost of Revenue: Intuit Inc. and MicroStrategy Incorporated

Gross Profit Comparison: Intuit Inc. and MicroStrategy Incorporated Trends
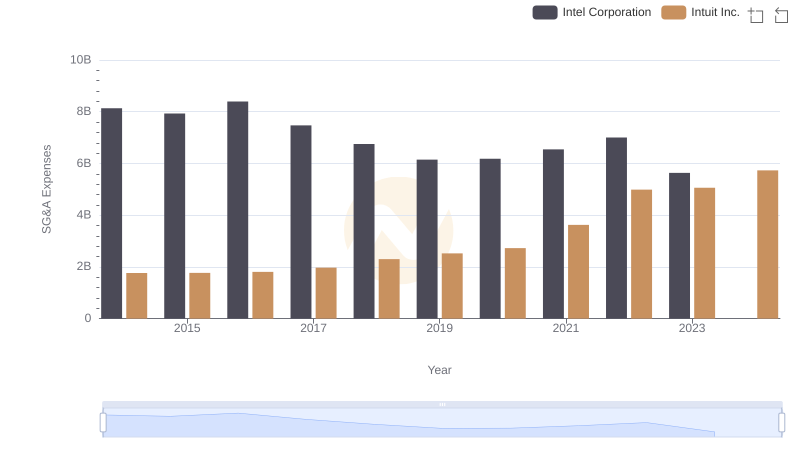
Intuit Inc. and Intel Corporation: SG&A Spending Patterns Compared
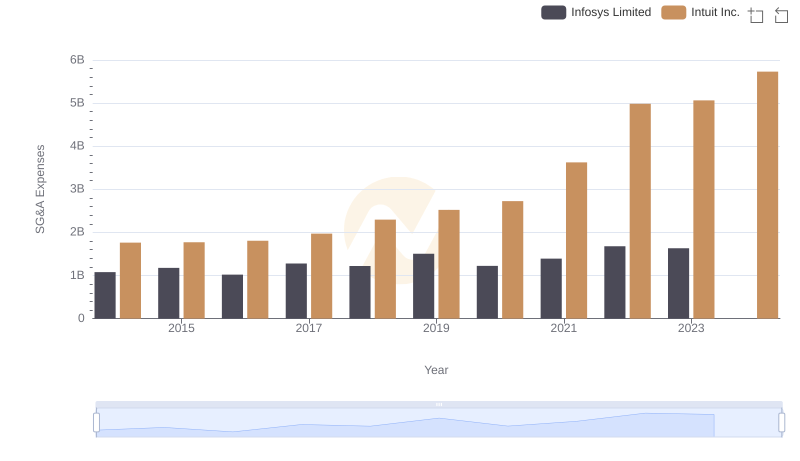
Intuit Inc. and Infosys Limited: SG&A Spending Patterns Compared
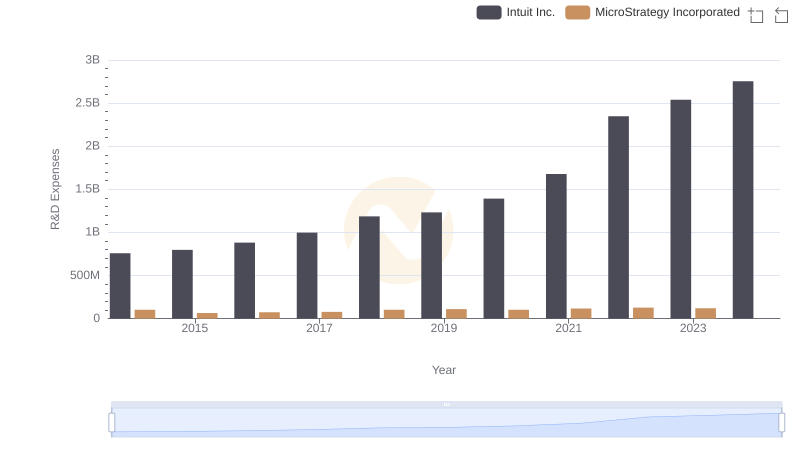
Intuit Inc. or MicroStrategy Incorporated: Who Invests More in Innovation?
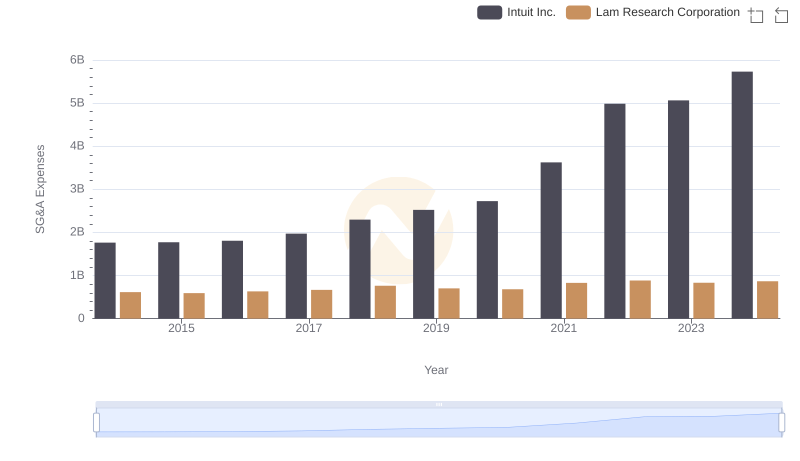
Comparing SG&A Expenses: Intuit Inc. vs Lam Research Corporation Trends and Insights
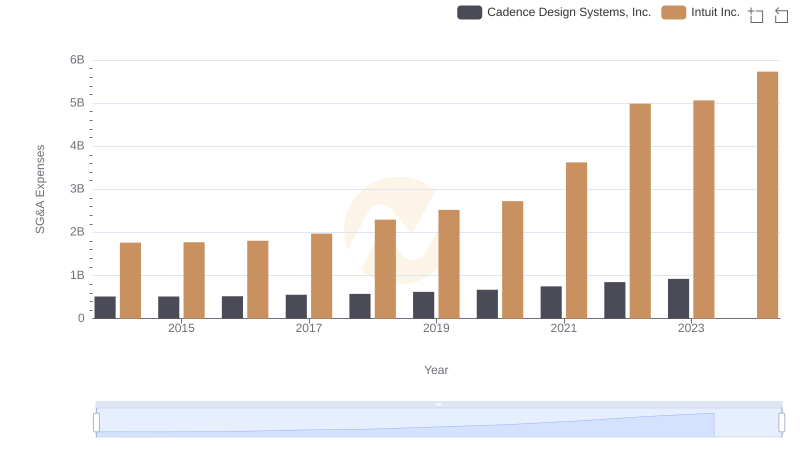
Operational Costs Compared: SG&A Analysis of Intuit Inc. and Cadence Design Systems, Inc.
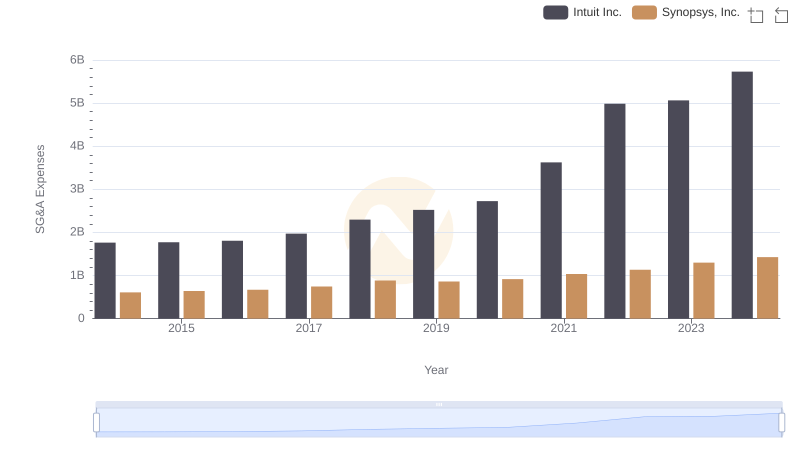
Who Optimizes SG&A Costs Better? Intuit Inc. or Synopsys, Inc.
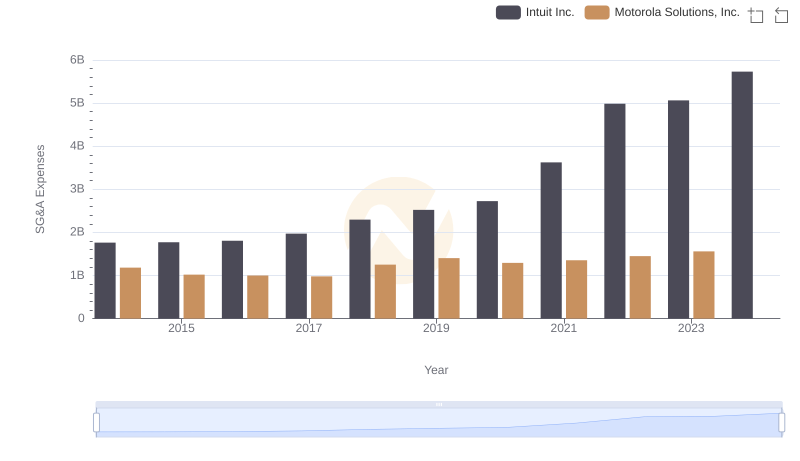
Selling, General, and Administrative Costs: Intuit Inc. vs Motorola Solutions, Inc.
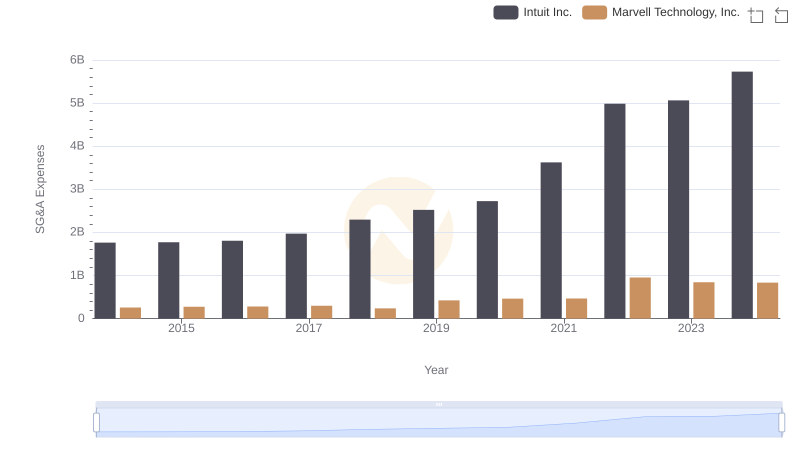
Operational Costs Compared: SG&A Analysis of Intuit Inc. and Marvell Technology, Inc.
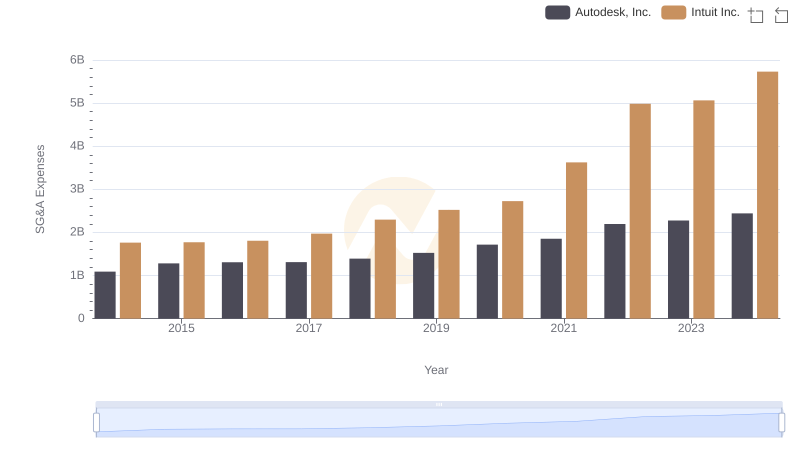
Intuit Inc. vs Autodesk, Inc.: SG&A Expense Trends