| __timestamp | Intuit Inc. | KLA Corporation |
|---|---|---|
| Wednesday, January 1, 2014 | 1762000000 | 384907000 |
| Thursday, January 1, 2015 | 1771000000 | 406864000 |
| Friday, January 1, 2016 | 1807000000 | 379399000 |
| Sunday, January 1, 2017 | 1973000000 | 389336000 |
| Monday, January 1, 2018 | 2298000000 | 443426000 |
| Tuesday, January 1, 2019 | 2524000000 | 599124000 |
| Wednesday, January 1, 2020 | 2727000000 | 734149000 |
| Friday, January 1, 2021 | 3626000000 | 729602000 |
| Saturday, January 1, 2022 | 4986000000 | 860007000 |
| Sunday, January 1, 2023 | 5062000000 | 986326000 |
| Monday, January 1, 2024 | 5730000000 | 969509000 |
Igniting the spark of knowledge
In the ever-evolving landscape of corporate finance, understanding spending patterns is crucial. Over the past decade, Intuit Inc. and KLA Corporation have showcased distinct trajectories in their Selling, General, and Administrative (SG&A) expenses. From 2014 to 2024, Intuit's SG&A expenses surged by over 225%, reflecting its aggressive growth strategy and market expansion. In contrast, KLA Corporation's expenses grew by approximately 150%, indicating a more measured approach.
These trends underscore the strategic priorities of each company, offering valuable insights for investors and industry analysts alike.
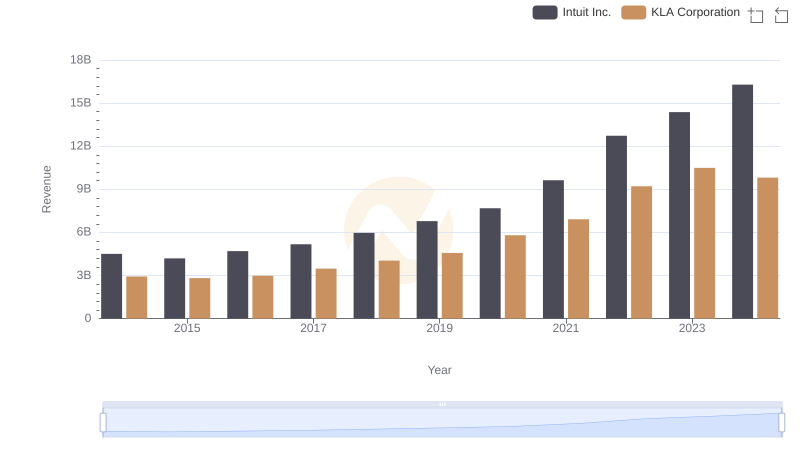
Revenue Showdown: Intuit Inc. vs KLA Corporation
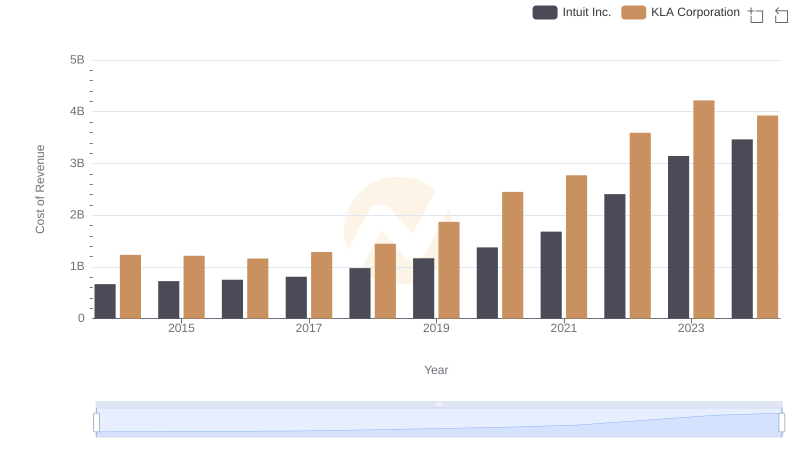
Cost of Revenue Trends: Intuit Inc. vs KLA Corporation
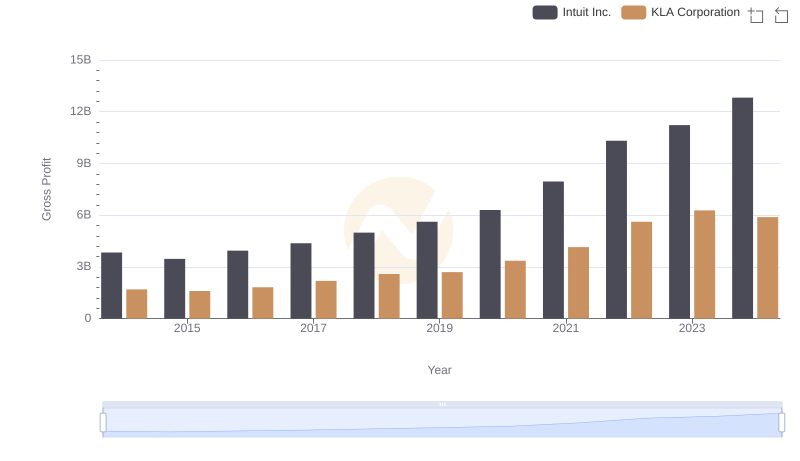
Intuit Inc. and KLA Corporation: A Detailed Gross Profit Analysis
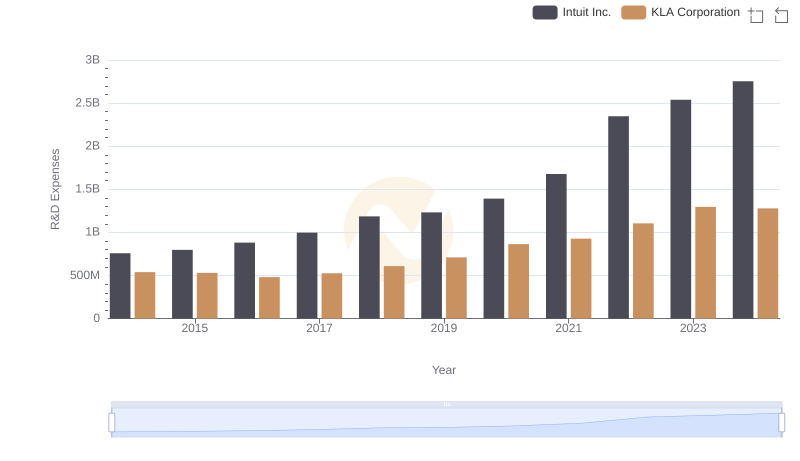
Research and Development: Comparing Key Metrics for Intuit Inc. and KLA Corporation
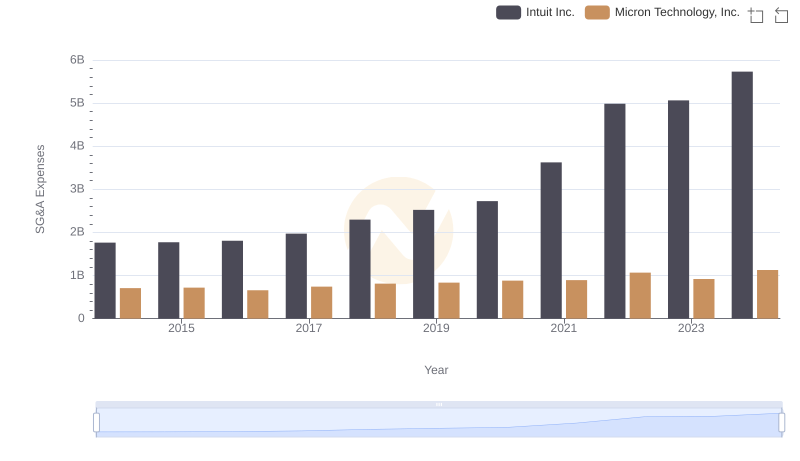
Who Optimizes SG&A Costs Better? Intuit Inc. or Micron Technology, Inc.
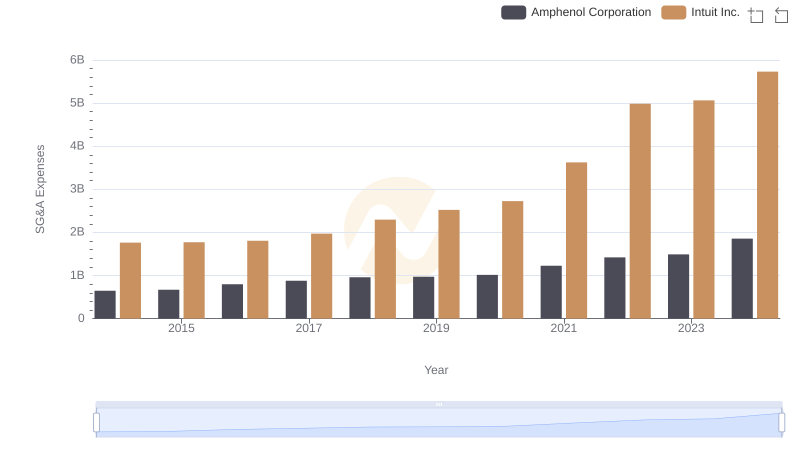
Who Optimizes SG&A Costs Better? Intuit Inc. or Amphenol Corporation
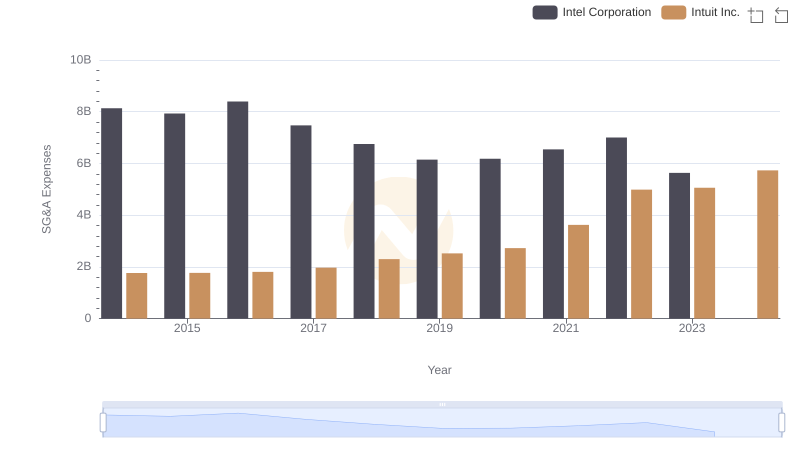
Intuit Inc. and Intel Corporation: SG&A Spending Patterns Compared
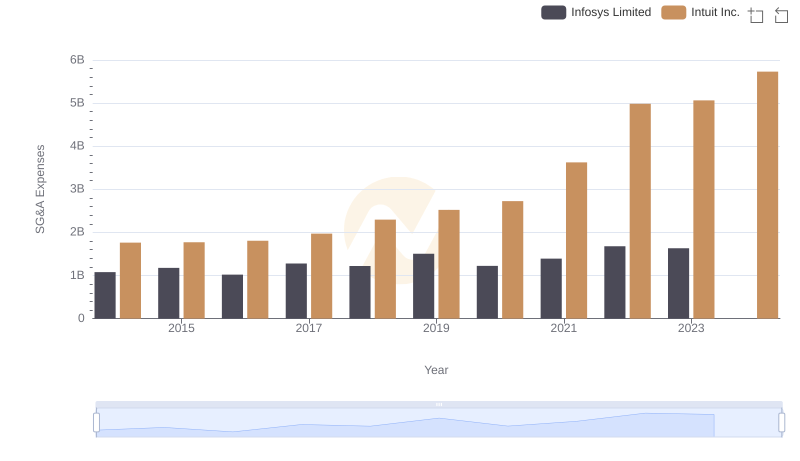
Intuit Inc. and Infosys Limited: SG&A Spending Patterns Compared
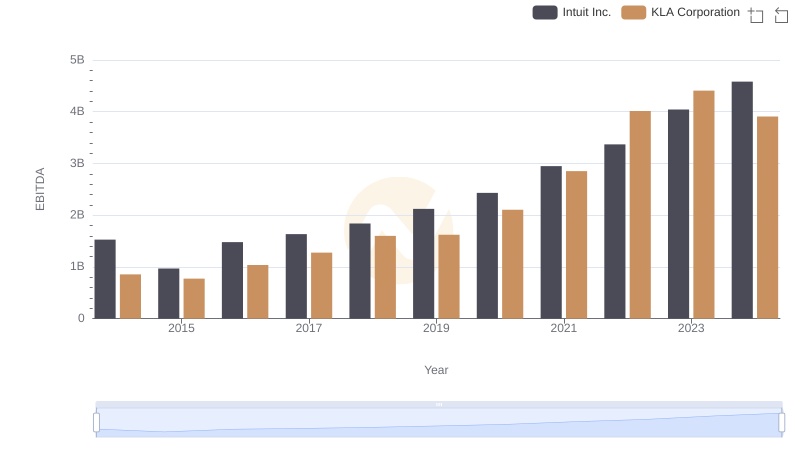
Intuit Inc. vs KLA Corporation: In-Depth EBITDA Performance Comparison
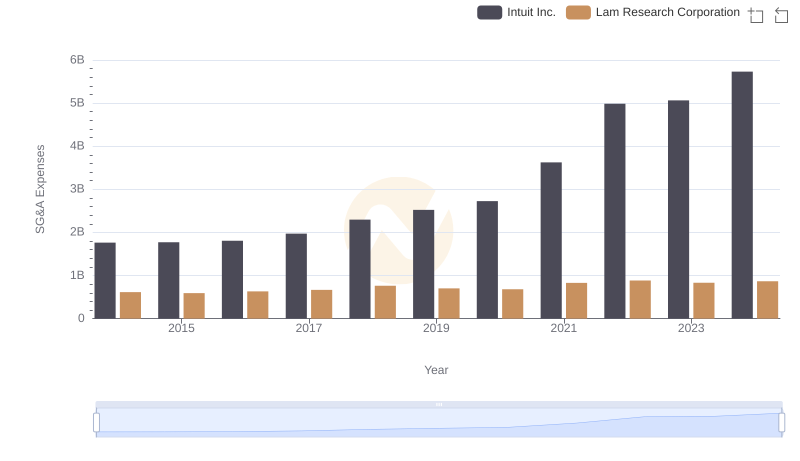
Comparing SG&A Expenses: Intuit Inc. vs Lam Research Corporation Trends and Insights
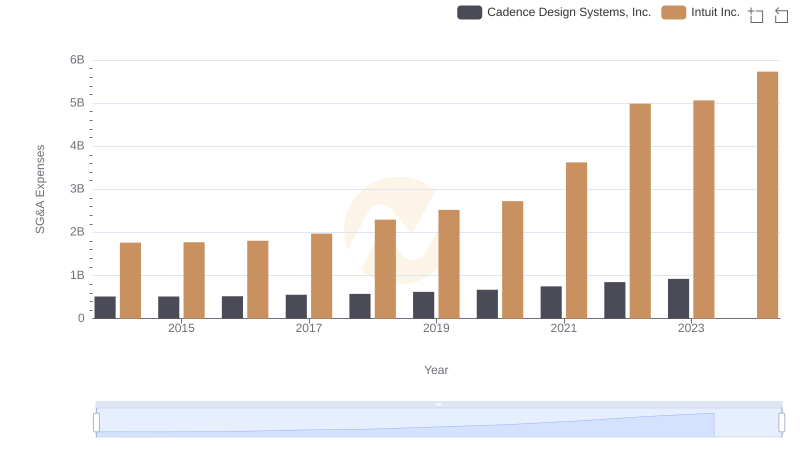
Operational Costs Compared: SG&A Analysis of Intuit Inc. and Cadence Design Systems, Inc.
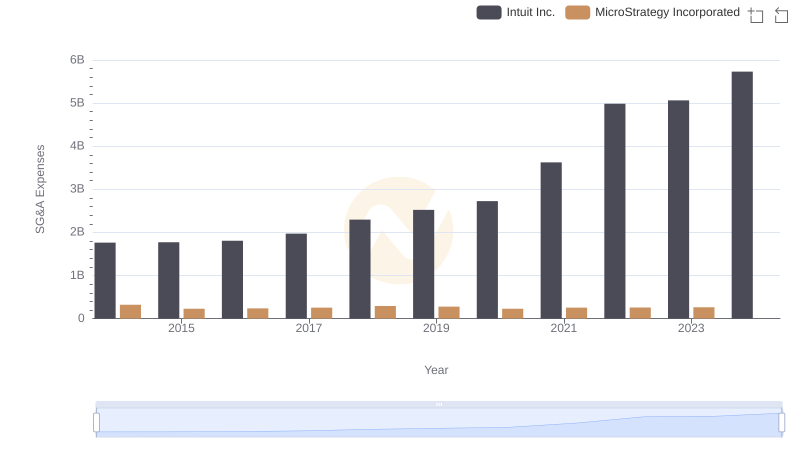
Intuit Inc. and MicroStrategy Incorporated: SG&A Spending Patterns Compared