| __timestamp | Infosys Limited | Intuit Inc. |
|---|---|---|
| Wednesday, January 1, 2014 | 1079000000 | 1762000000 |
| Thursday, January 1, 2015 | 1176000000 | 1771000000 |
| Friday, January 1, 2016 | 1020000000 | 1807000000 |
| Sunday, January 1, 2017 | 1279000000 | 1973000000 |
| Monday, January 1, 2018 | 1220000000 | 2298000000 |
| Tuesday, January 1, 2019 | 1504000000 | 2524000000 |
| Wednesday, January 1, 2020 | 1223000000 | 2727000000 |
| Friday, January 1, 2021 | 1391000000 | 3626000000 |
| Saturday, January 1, 2022 | 1678000000 | 4986000000 |
| Sunday, January 1, 2023 | 1632000000 | 5062000000 |
| Monday, January 1, 2024 | 5730000000 |
Igniting the spark of knowledge
In the ever-evolving landscape of global business, understanding the financial strategies of industry leaders is crucial. This chart offers a fascinating glimpse into the SG&A (Selling, General, and Administrative) spending patterns of two tech titans: Intuit Inc. and Infosys Limited, from 2014 to 2023.
Intuit Inc., renowned for its financial software, has consistently increased its SG&A expenses, reflecting a strategic focus on growth and market expansion. From 2014 to 2023, Intuit's spending surged by approximately 187%, peaking at over $5 billion in 2023. This trend underscores Intuit's commitment to innovation and customer acquisition.
Conversely, Infosys Limited, a leader in IT services, exhibited a more conservative approach, with a 51% increase in SG&A expenses over the same period. This strategy highlights Infosys's emphasis on operational efficiency and cost management.
The data for 2024 is incomplete, leaving room for speculation on future trends. As these companies continue to navigate the complexities of the global market, their SG&A strategies will undoubtedly play a pivotal role in shaping their trajectories.
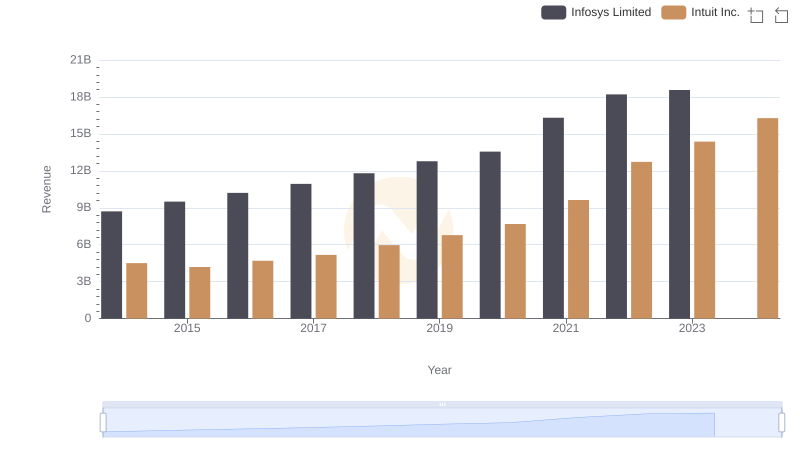
Revenue Showdown: Intuit Inc. vs Infosys Limited
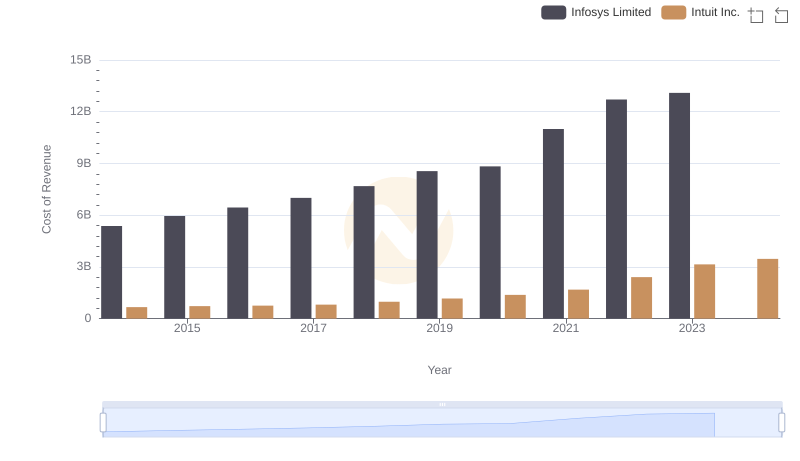
Comparing Cost of Revenue Efficiency: Intuit Inc. vs Infosys Limited
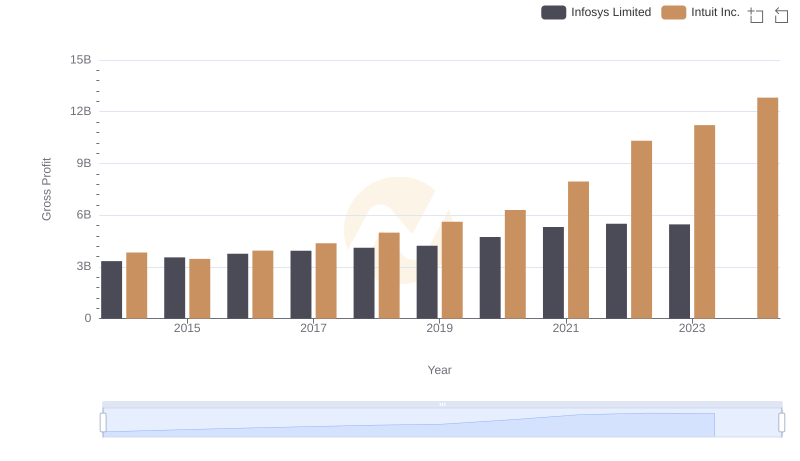
Gross Profit Trends Compared: Intuit Inc. vs Infosys Limited
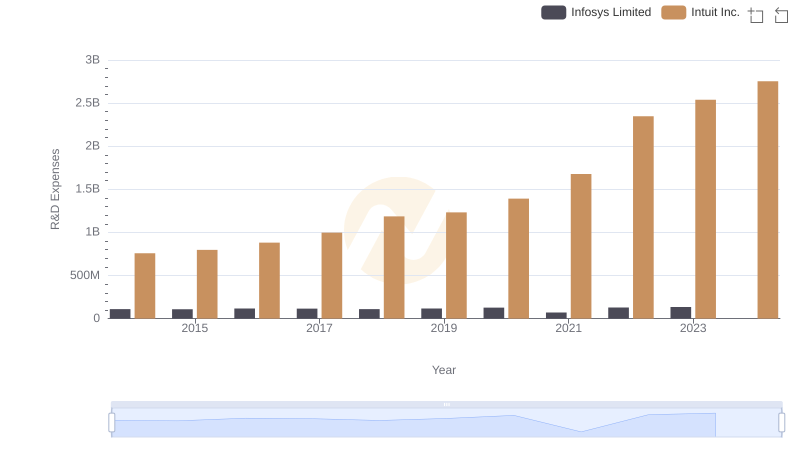
Research and Development Investment: Intuit Inc. vs Infosys Limited
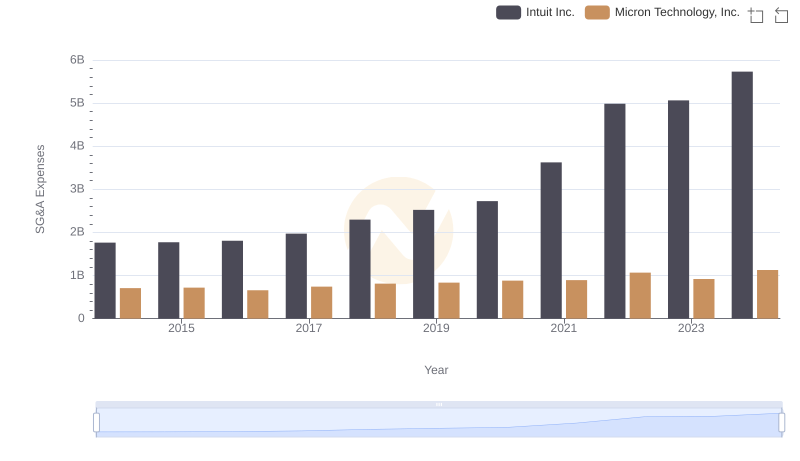
Who Optimizes SG&A Costs Better? Intuit Inc. or Micron Technology, Inc.
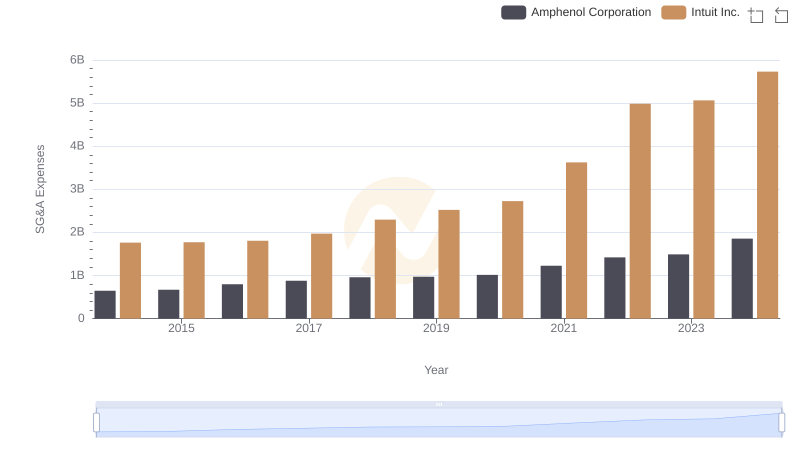
Who Optimizes SG&A Costs Better? Intuit Inc. or Amphenol Corporation
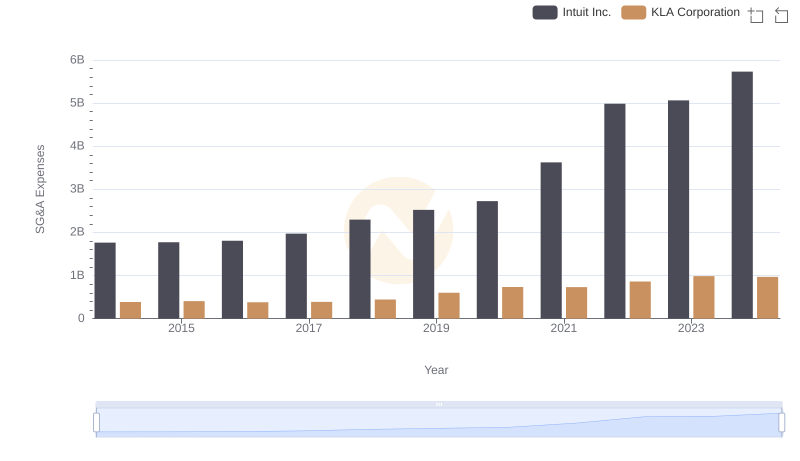
Intuit Inc. and KLA Corporation: SG&A Spending Patterns Compared
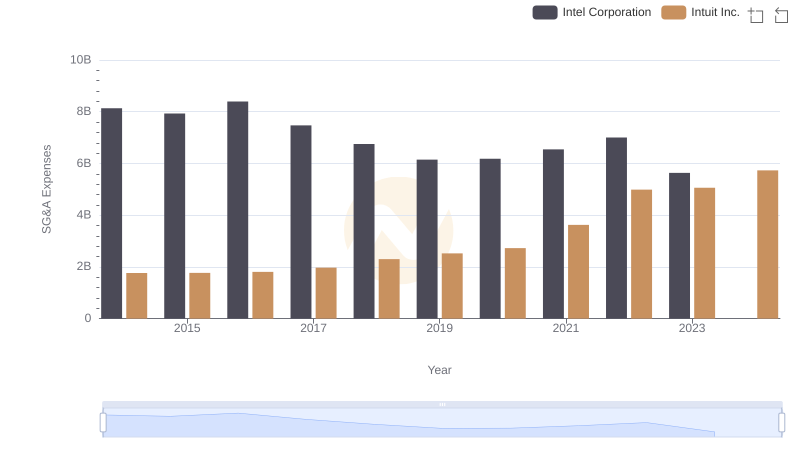
Intuit Inc. and Intel Corporation: SG&A Spending Patterns Compared
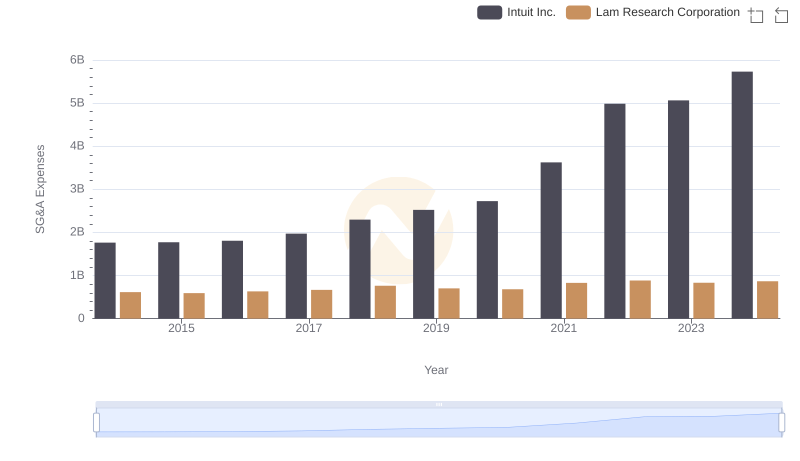
Comparing SG&A Expenses: Intuit Inc. vs Lam Research Corporation Trends and Insights
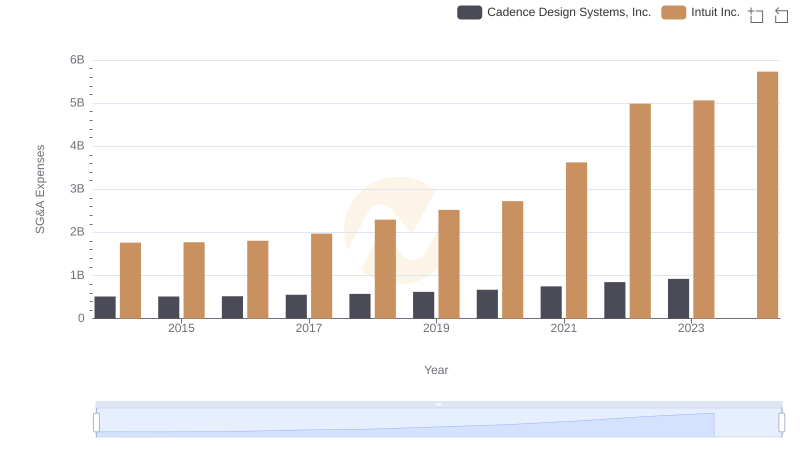
Operational Costs Compared: SG&A Analysis of Intuit Inc. and Cadence Design Systems, Inc.
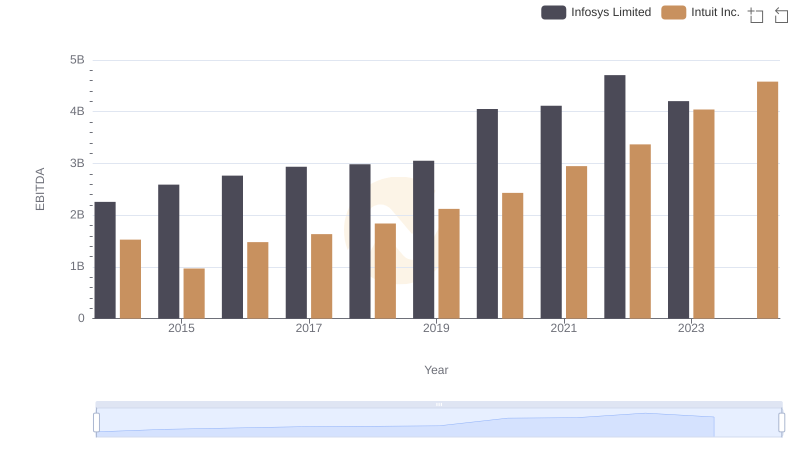
Intuit Inc. and Infosys Limited: A Detailed Examination of EBITDA Performance
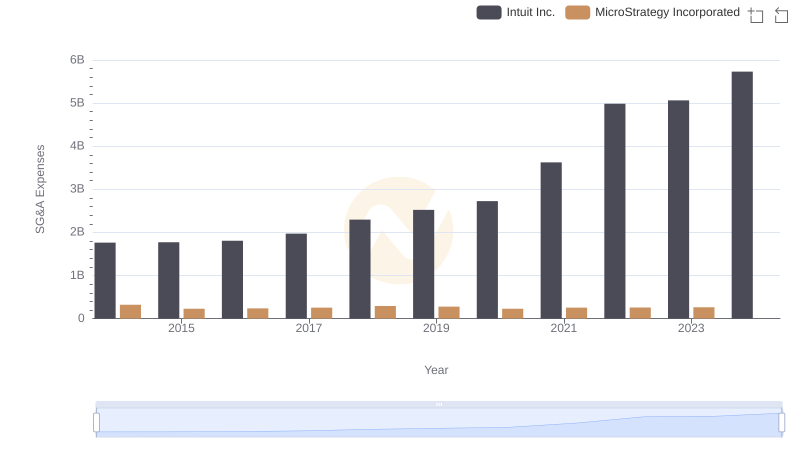
Intuit Inc. and MicroStrategy Incorporated: SG&A Spending Patterns Compared