| __timestamp | Cadence Design Systems, Inc. | Intuit Inc. |
|---|---|---|
| Wednesday, January 1, 2014 | 513307000 | 1762000000 |
| Thursday, January 1, 2015 | 512414000 | 1771000000 |
| Friday, January 1, 2016 | 520300000 | 1807000000 |
| Sunday, January 1, 2017 | 553342000 | 1973000000 |
| Monday, January 1, 2018 | 573075000 | 2298000000 |
| Tuesday, January 1, 2019 | 621479000 | 2524000000 |
| Wednesday, January 1, 2020 | 670885000 | 2727000000 |
| Friday, January 1, 2021 | 749280000 | 3626000000 |
| Saturday, January 1, 2022 | 846340000 | 4986000000 |
| Sunday, January 1, 2023 | 920649000 | 5062000000 |
| Monday, January 1, 2024 | 1039766000 | 5730000000 |
Unleashing insights
In the ever-evolving landscape of technology, operational efficiency is paramount. Over the past decade, Intuit Inc. and Cadence Design Systems, Inc. have showcased distinct trajectories in their Selling, General, and Administrative (SG&A) expenses. From 2014 to 2023, Intuit's SG&A expenses surged by approximately 187%, reflecting its aggressive growth strategy and market expansion. In contrast, Cadence Design Systems experienced a more modest increase of around 79% during the same period, indicating a steady yet cautious approach.
By 2023, Intuit's SG&A expenses were nearly five times higher than Cadence's, highlighting its larger scale and broader operational scope. However, the data for 2024 reveals a gap for Cadence, suggesting potential shifts or strategic pivots. This analysis underscores the importance of understanding operational costs in evaluating corporate strategies and market positioning.
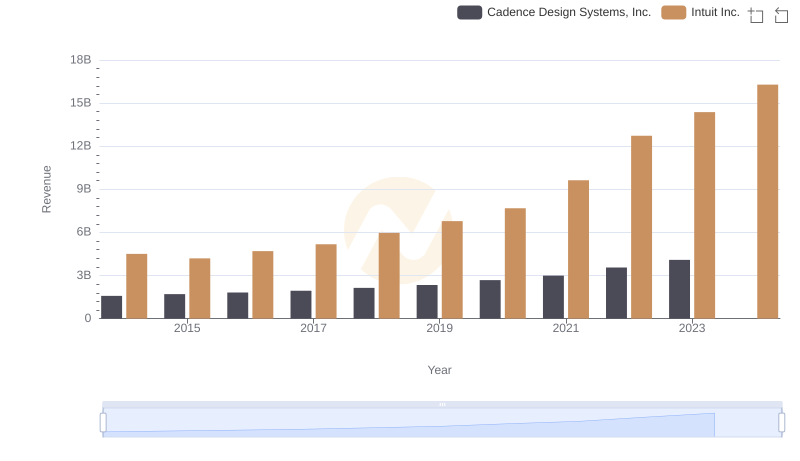
Who Generates More Revenue? Intuit Inc. or Cadence Design Systems, Inc.
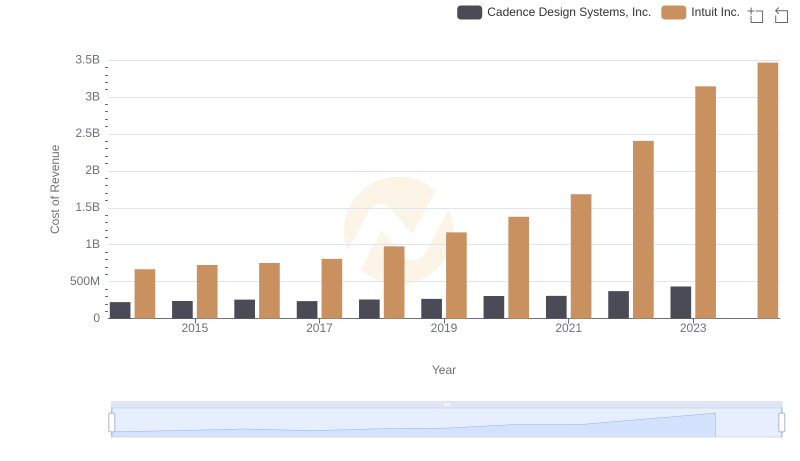
Cost of Revenue Trends: Intuit Inc. vs Cadence Design Systems, Inc.
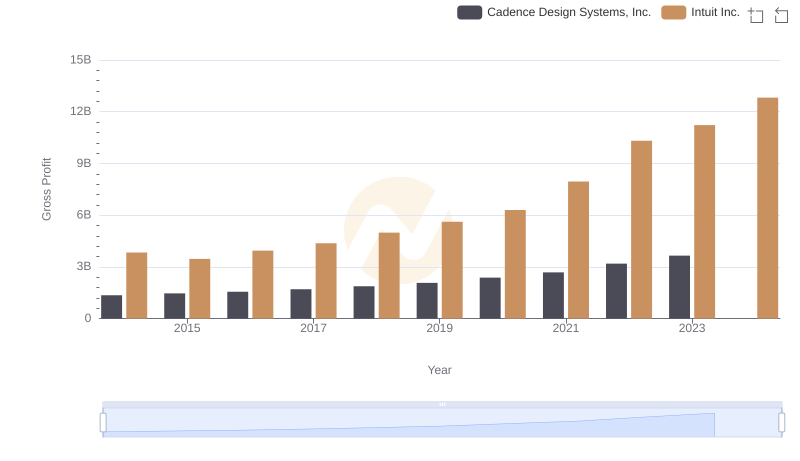
Key Insights on Gross Profit: Intuit Inc. vs Cadence Design Systems, Inc.
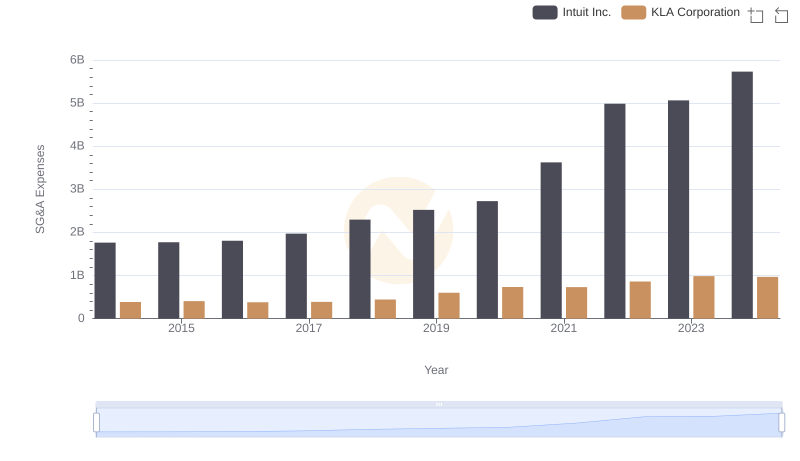
Intuit Inc. and KLA Corporation: SG&A Spending Patterns Compared
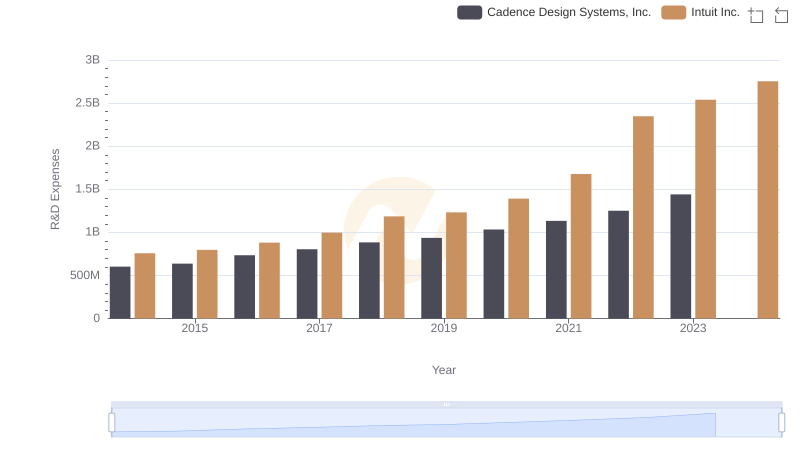
Comparing Innovation Spending: Intuit Inc. and Cadence Design Systems, Inc.
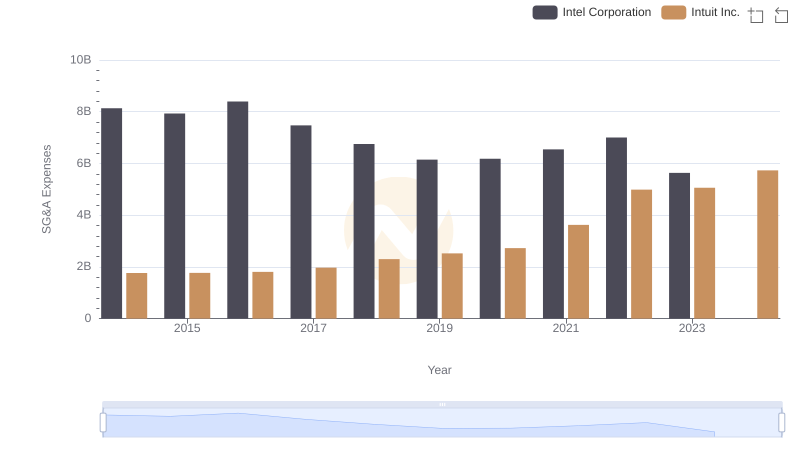
Intuit Inc. and Intel Corporation: SG&A Spending Patterns Compared
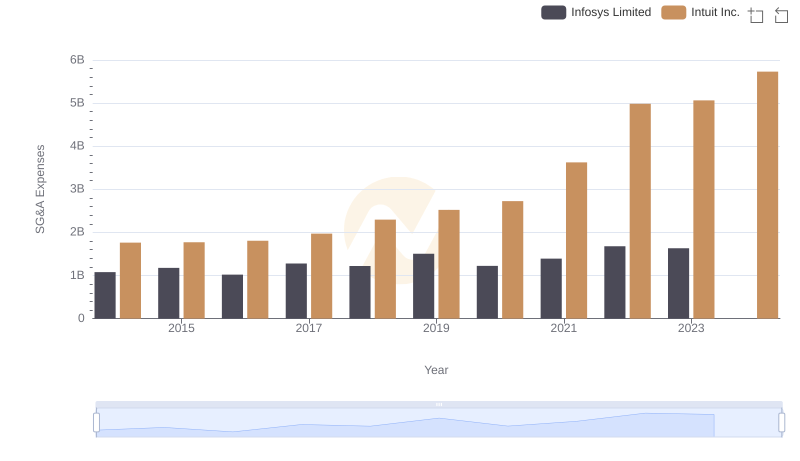
Intuit Inc. and Infosys Limited: SG&A Spending Patterns Compared
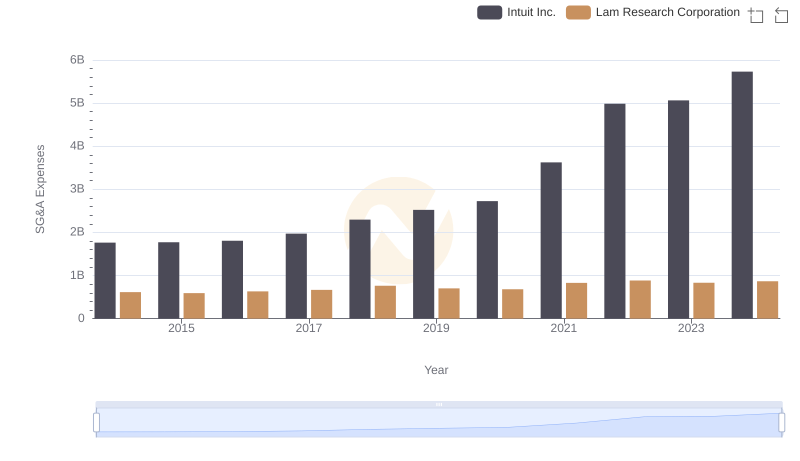
Comparing SG&A Expenses: Intuit Inc. vs Lam Research Corporation Trends and Insights
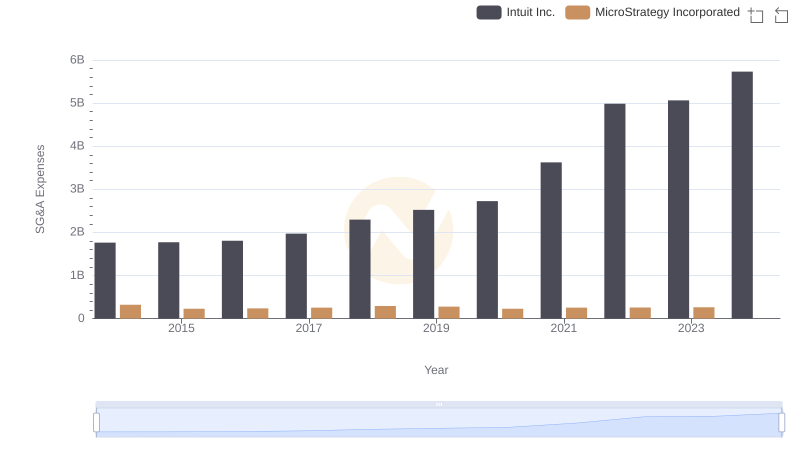
Intuit Inc. and MicroStrategy Incorporated: SG&A Spending Patterns Compared
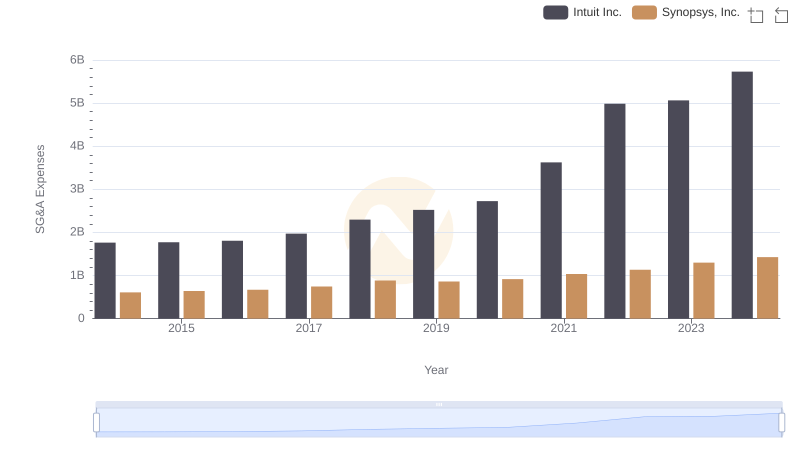
Who Optimizes SG&A Costs Better? Intuit Inc. or Synopsys, Inc.
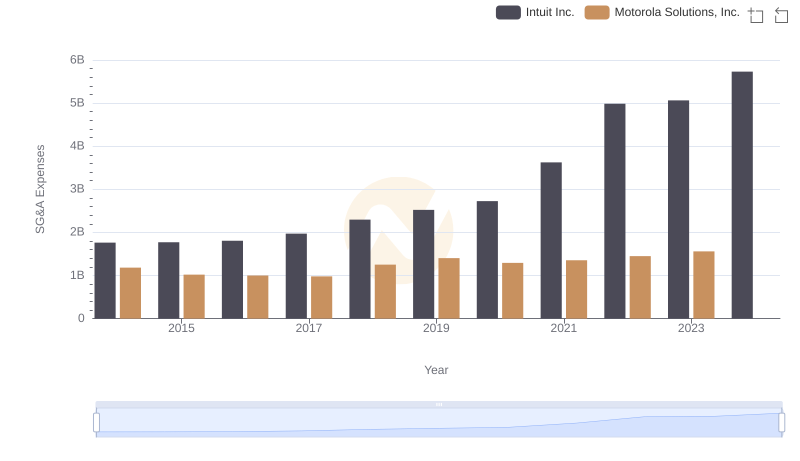
Selling, General, and Administrative Costs: Intuit Inc. vs Motorola Solutions, Inc.
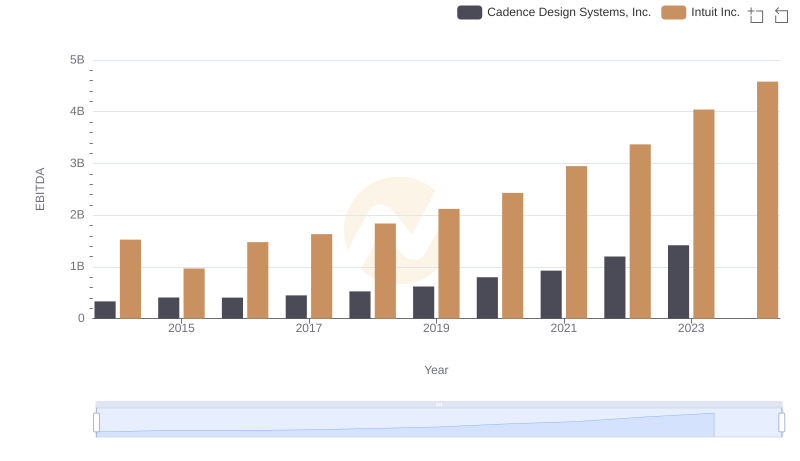
Comparative EBITDA Analysis: Intuit Inc. vs Cadence Design Systems, Inc.