| __timestamp | Gartner, Inc. | International Business Machines Corporation |
|---|---|---|
| Wednesday, January 1, 2014 | 347441000 | 24962000000 |
| Thursday, January 1, 2015 | 328373000 | 20268000000 |
| Friday, January 1, 2016 | 365793000 | 17341000000 |
| Sunday, January 1, 2017 | 227017000 | 16556000000 |
| Monday, January 1, 2018 | 563999000 | 16545000000 |
| Tuesday, January 1, 2019 | 677731000 | 14609000000 |
| Wednesday, January 1, 2020 | 765684000 | 10555000000 |
| Friday, January 1, 2021 | 1346852000 | 12409000000 |
| Saturday, January 1, 2022 | 1345344000 | 7174000000 |
| Sunday, January 1, 2023 | 1471004000 | 14693000000 |
| Monday, January 1, 2024 | 1720735000 | 6015000000 |
In pursuit of knowledge
In the ever-evolving landscape of technology and consulting, the EBITDA performance of International Business Machines Corporation (IBM) and Gartner, Inc. offers a fascinating glimpse into their financial health over the past decade. From 2014 to 2023, IBM's EBITDA has shown a significant decline of approximately 41%, dropping from its peak in 2014. In contrast, Gartner has experienced a remarkable growth of over 320% during the same period, reflecting its expanding influence in the industry.
This comparison underscores the dynamic shifts within the tech and consulting sectors, with Gartner emerging as a formidable player.
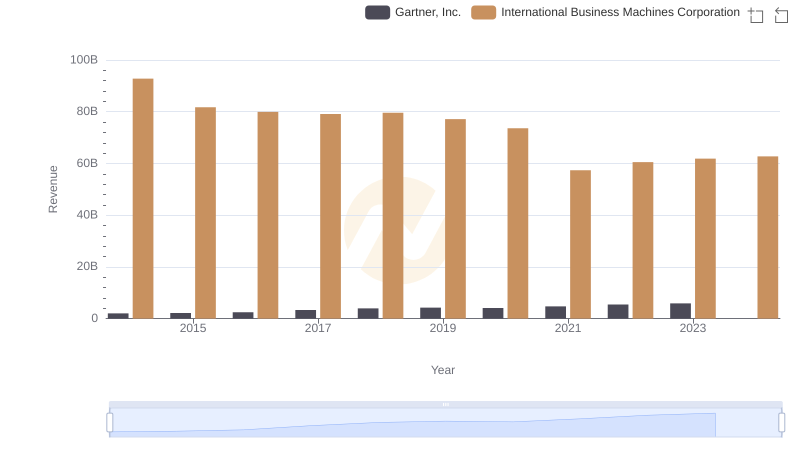
International Business Machines Corporation vs Gartner, Inc.: Examining Key Revenue Metrics
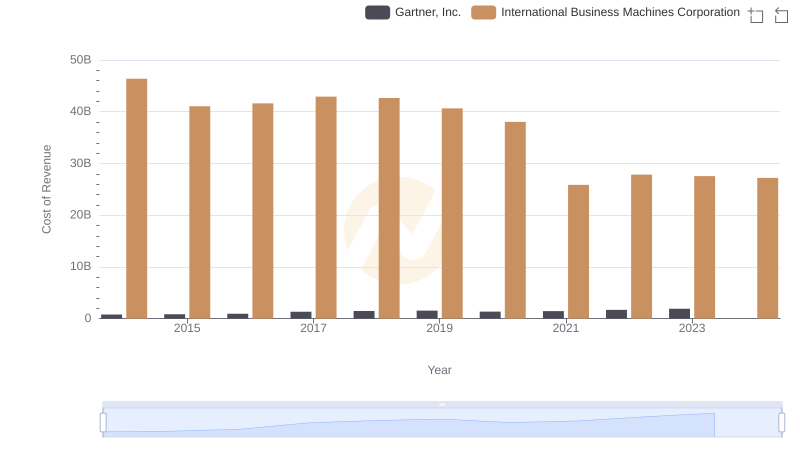
Cost Insights: Breaking Down International Business Machines Corporation and Gartner, Inc.'s Expenses
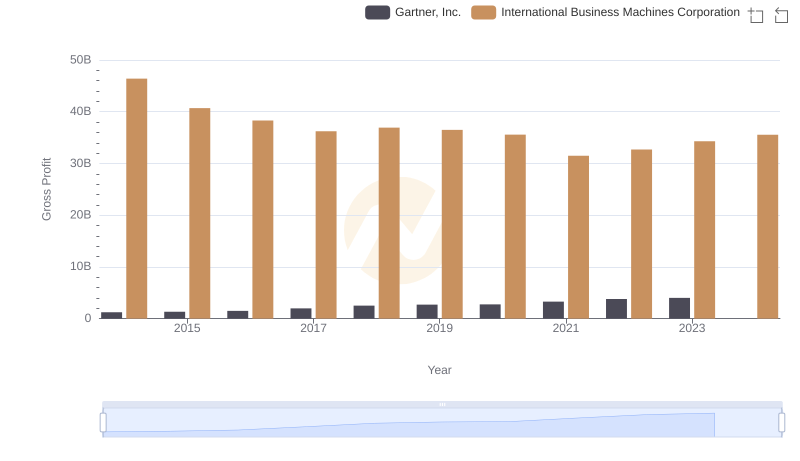
Who Generates Higher Gross Profit? International Business Machines Corporation or Gartner, Inc.
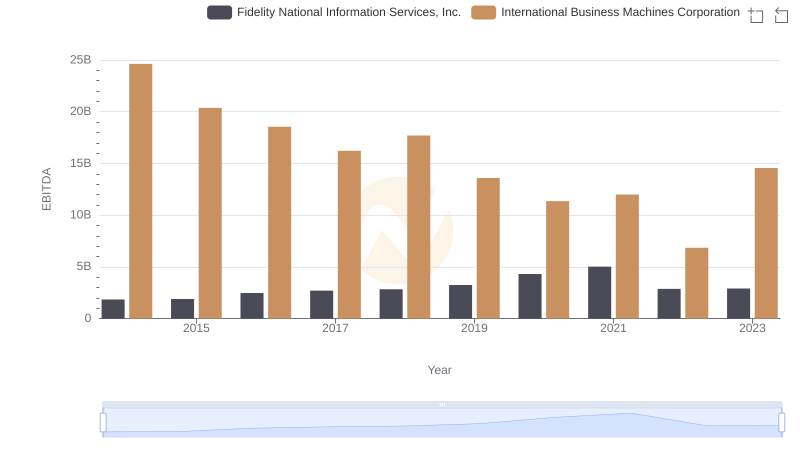
International Business Machines Corporation vs Fidelity National Information Services, Inc.: In-Depth EBITDA Performance Comparison
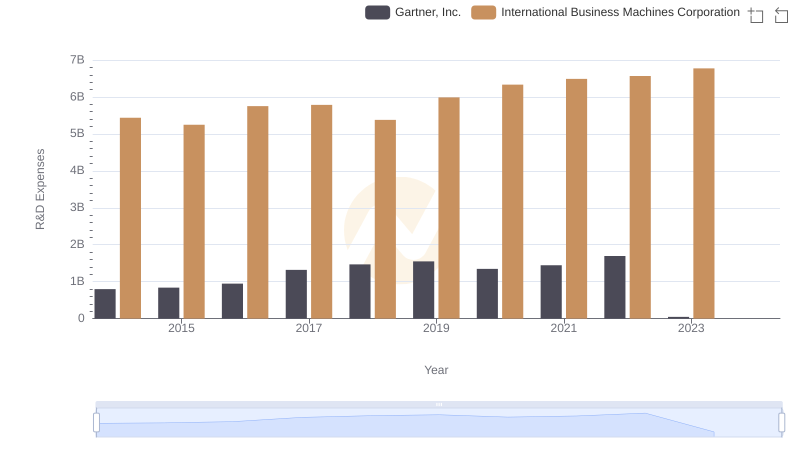
Research and Development Expenses Breakdown: International Business Machines Corporation vs Gartner, Inc.
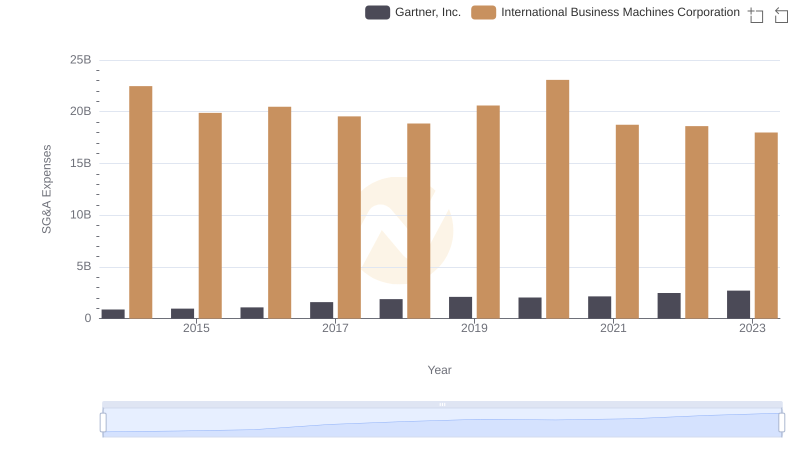
SG&A Efficiency Analysis: Comparing International Business Machines Corporation and Gartner, Inc.
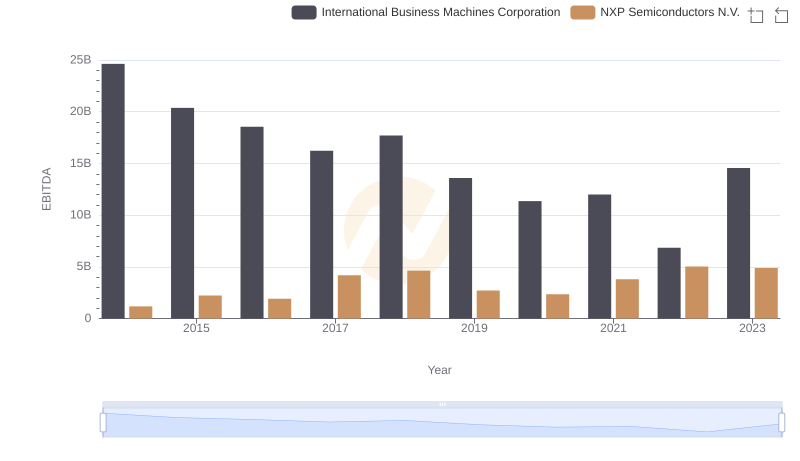
International Business Machines Corporation and NXP Semiconductors N.V.: A Detailed Examination of EBITDA Performance
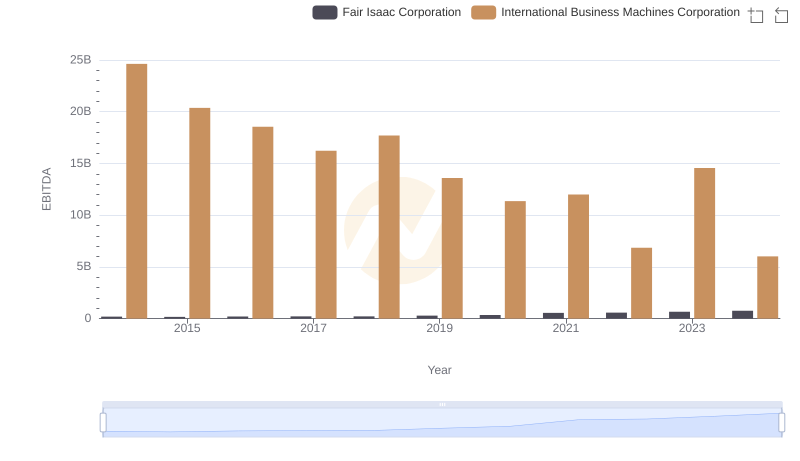
EBITDA Metrics Evaluated: International Business Machines Corporation vs Fair Isaac Corporation
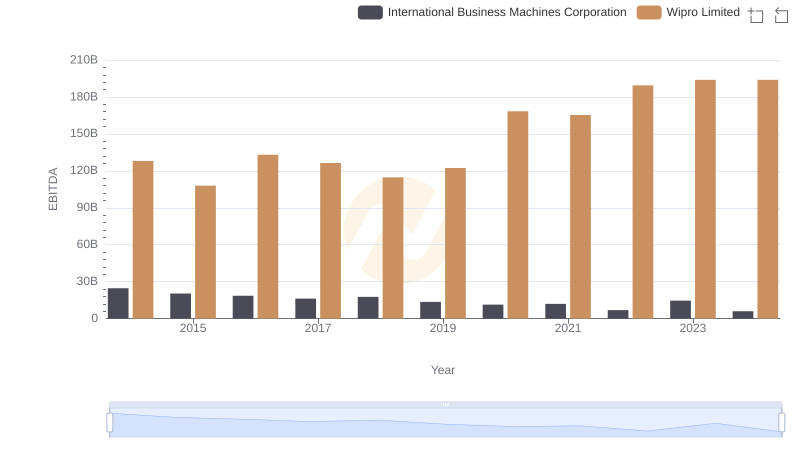
International Business Machines Corporation vs Wipro Limited: In-Depth EBITDA Performance Comparison
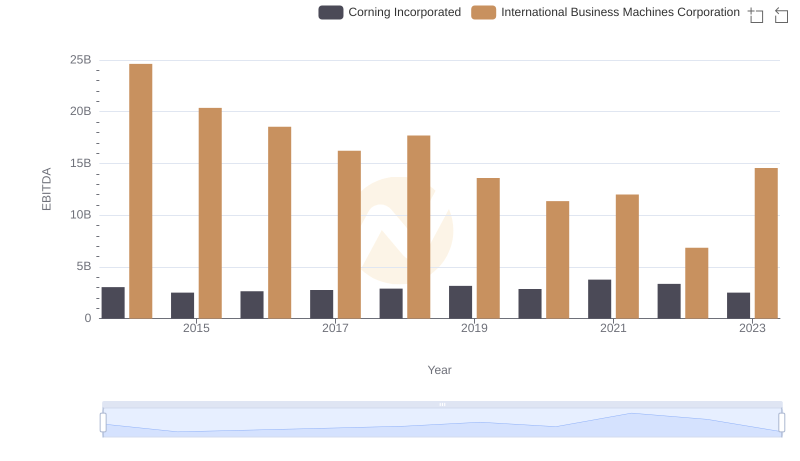
Comprehensive EBITDA Comparison: International Business Machines Corporation vs Corning Incorporated
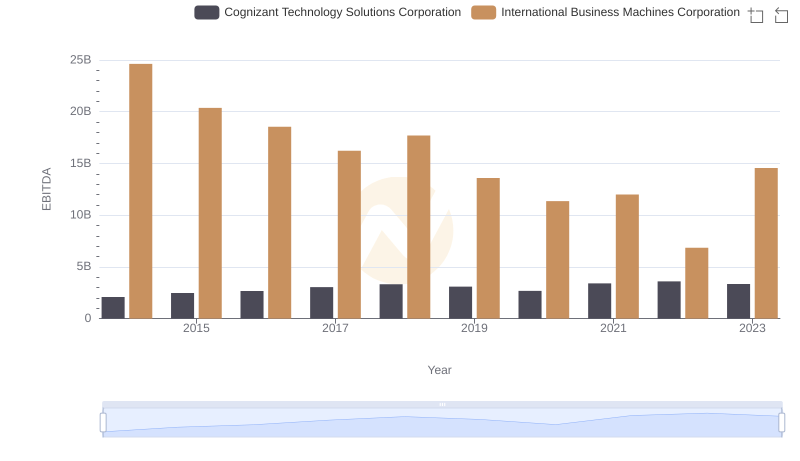
A Side-by-Side Analysis of EBITDA: International Business Machines Corporation and Cognizant Technology Solutions Corporation
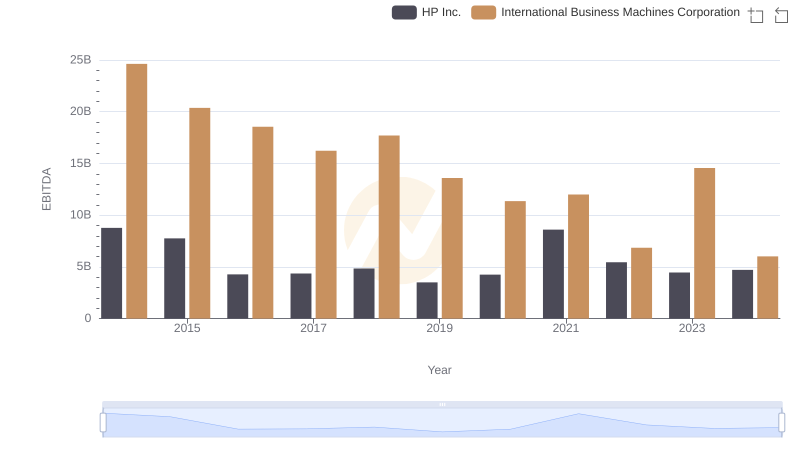
Professional EBITDA Benchmarking: International Business Machines Corporation vs HP Inc.