| __timestamp | International Business Machines Corporation | VMware, Inc. |
|---|---|---|
| Wednesday, January 1, 2014 | 24962000000 | 1526000000 |
| Thursday, January 1, 2015 | 20268000000 | 1395000000 |
| Friday, January 1, 2016 | 17341000000 | 1548000000 |
| Sunday, January 1, 2017 | 16556000000 | 1819000000 |
| Monday, January 1, 2018 | 16545000000 | 2181000000 |
| Tuesday, January 1, 2019 | 14609000000 | 3495000000 |
| Wednesday, January 1, 2020 | 10555000000 | 2479000000 |
| Friday, January 1, 2021 | 12409000000 | 3646000000 |
| Saturday, January 1, 2022 | 7174000000 | 3446000000 |
| Sunday, January 1, 2023 | 14693000000 | 3273000000 |
| Monday, January 1, 2024 | 6015000000 |
Unlocking the unknown
In the ever-evolving landscape of technology, the financial performance of industry giants like International Business Machines Corporation (IBM) and VMware, Inc. offers valuable insights. Over the past decade, IBM's EBITDA has shown a significant decline, dropping from its peak in 2014 to nearly 60% less by 2024. This trend reflects the company's strategic shifts and market challenges. Meanwhile, VMware has demonstrated a more stable trajectory, with its EBITDA increasing by over 100% from 2014 to 2023, showcasing its resilience and adaptability in the cloud computing sector.
These trends underscore the dynamic nature of the tech industry and the varying strategies of its key players.
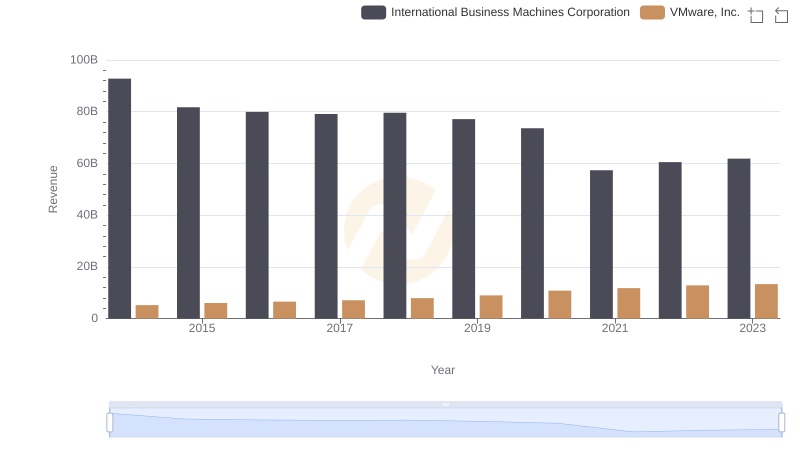
Revenue Insights: International Business Machines Corporation and VMware, Inc. Performance Compared
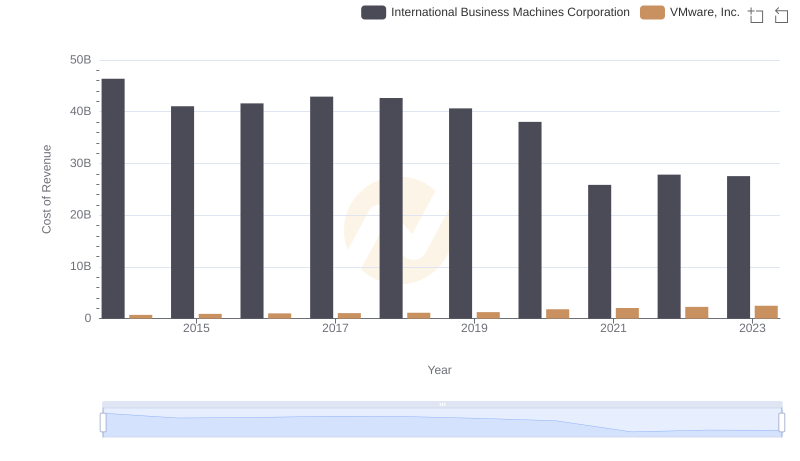
Cost of Revenue Trends: International Business Machines Corporation vs VMware, Inc.
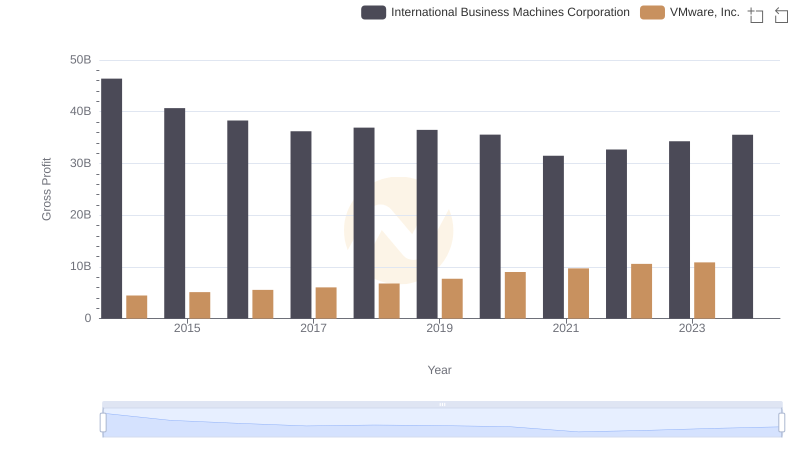
Gross Profit Analysis: Comparing International Business Machines Corporation and VMware, Inc.
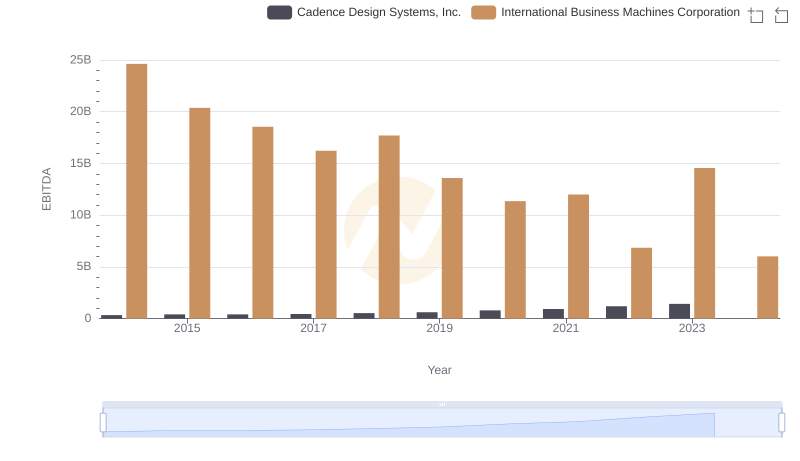
EBITDA Analysis: Evaluating International Business Machines Corporation Against Cadence Design Systems, Inc.
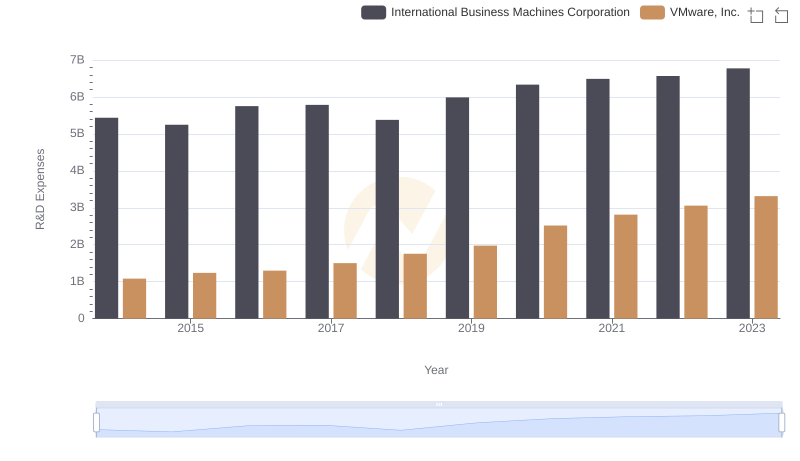
Research and Development: Comparing Key Metrics for International Business Machines Corporation and VMware, Inc.
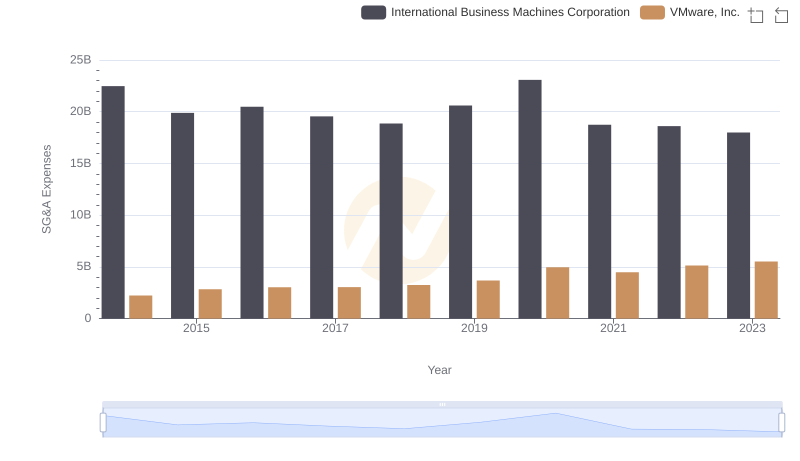
Breaking Down SG&A Expenses: International Business Machines Corporation vs VMware, Inc.
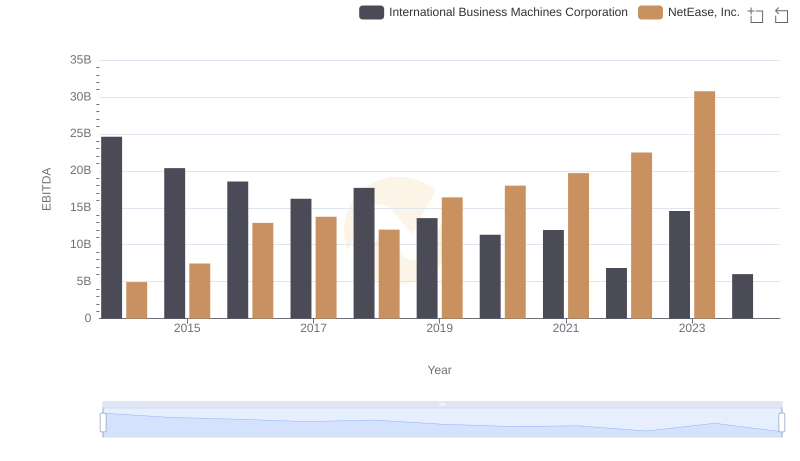
A Professional Review of EBITDA: International Business Machines Corporation Compared to NetEase, Inc.
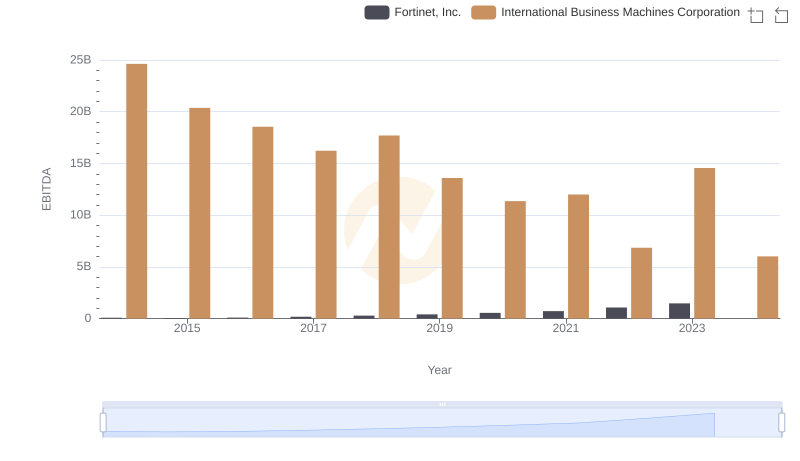
A Side-by-Side Analysis of EBITDA: International Business Machines Corporation and Fortinet, Inc.
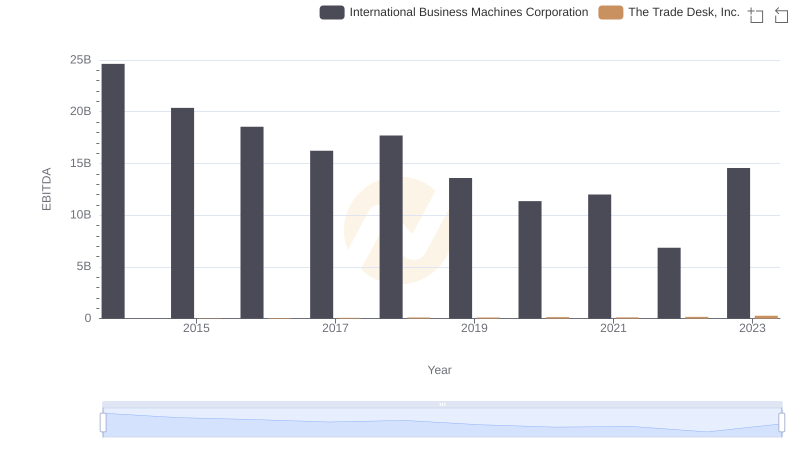
A Professional Review of EBITDA: International Business Machines Corporation Compared to The Trade Desk, Inc.
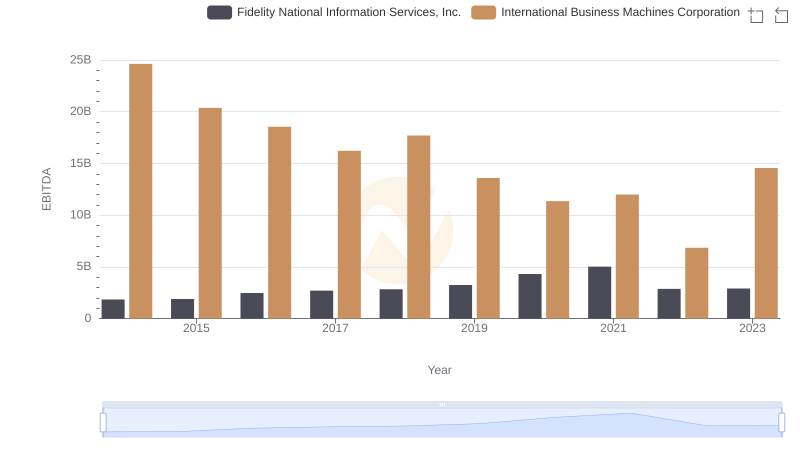
International Business Machines Corporation vs Fidelity National Information Services, Inc.: In-Depth EBITDA Performance Comparison
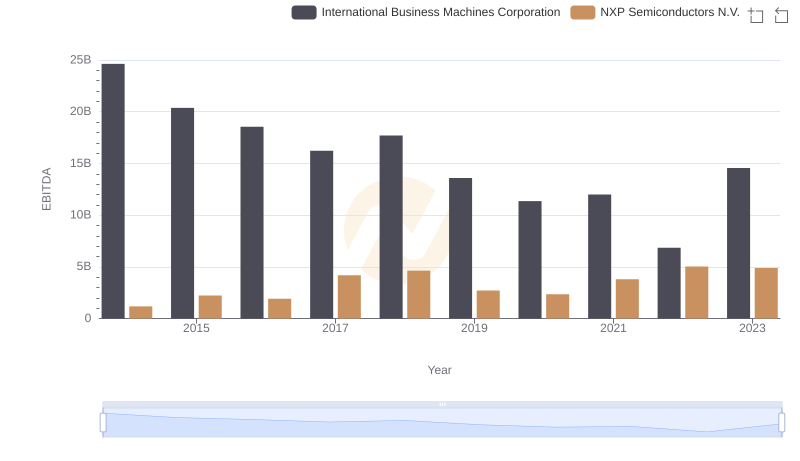
International Business Machines Corporation and NXP Semiconductors N.V.: A Detailed Examination of EBITDA Performance
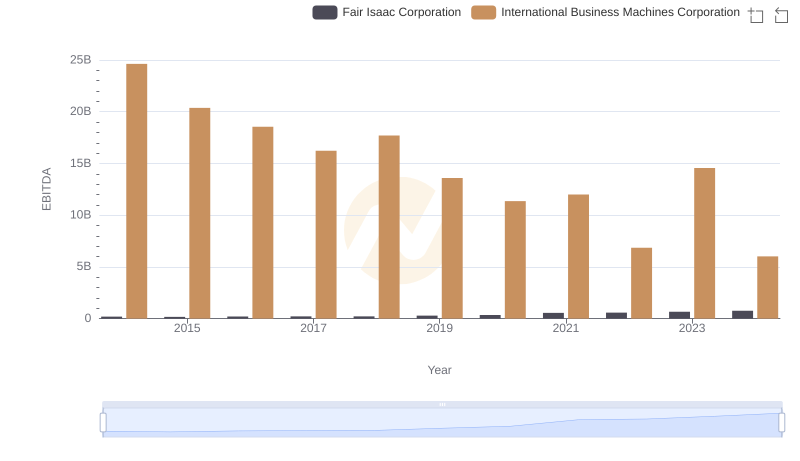
EBITDA Metrics Evaluated: International Business Machines Corporation vs Fair Isaac Corporation