| __timestamp | International Business Machines Corporation | NetEase, Inc. |
|---|---|---|
| Wednesday, January 1, 2014 | 24962000000 | 4939587000 |
| Thursday, January 1, 2015 | 20268000000 | 7454573000 |
| Friday, January 1, 2016 | 17341000000 | 12956379000 |
| Sunday, January 1, 2017 | 16556000000 | 13786691000 |
| Monday, January 1, 2018 | 16545000000 | 12037479000 |
| Tuesday, January 1, 2019 | 14609000000 | 16404433000 |
| Wednesday, January 1, 2020 | 10555000000 | 17996187000 |
| Friday, January 1, 2021 | 12409000000 | 19692797000 |
| Saturday, January 1, 2022 | 7174000000 | 22486802000 |
| Sunday, January 1, 2023 | 14693000000 | 30764404000 |
| Monday, January 1, 2024 | 6015000000 |
Infusing magic into the data realm
In the ever-evolving landscape of global technology, the financial performance of industry giants like International Business Machines Corporation (IBM) and NetEase, Inc. offers a fascinating glimpse into their strategic maneuvers. Over the past decade, IBM's EBITDA has seen a significant decline, dropping from its peak in 2014 to nearly 75% less by 2024. This trend reflects IBM's ongoing transformation and challenges in adapting to the digital age.
Conversely, NetEase, Inc., a leading Chinese internet technology company, has experienced a robust growth trajectory. From 2014 to 2023, NetEase's EBITDA surged by over 500%, showcasing its successful expansion into gaming and e-commerce sectors. The stark contrast between these two companies highlights the dynamic nature of the tech industry, where adaptability and innovation are key to sustained growth.
As we look to the future, the missing data for 2024 suggests potential uncertainties, urging investors to stay vigilant.
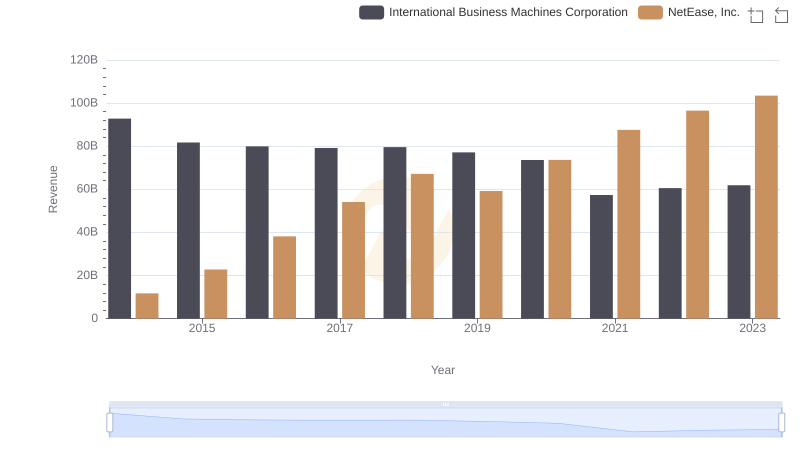
Comparing Revenue Performance: International Business Machines Corporation or NetEase, Inc.?
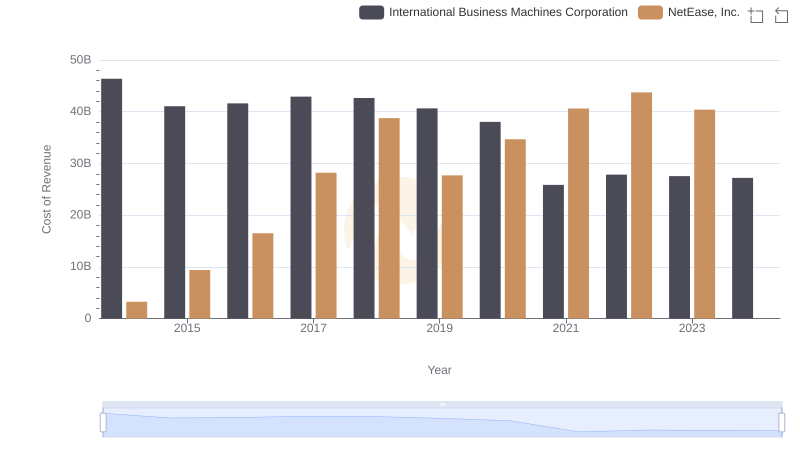
Cost of Revenue: Key Insights for International Business Machines Corporation and NetEase, Inc.
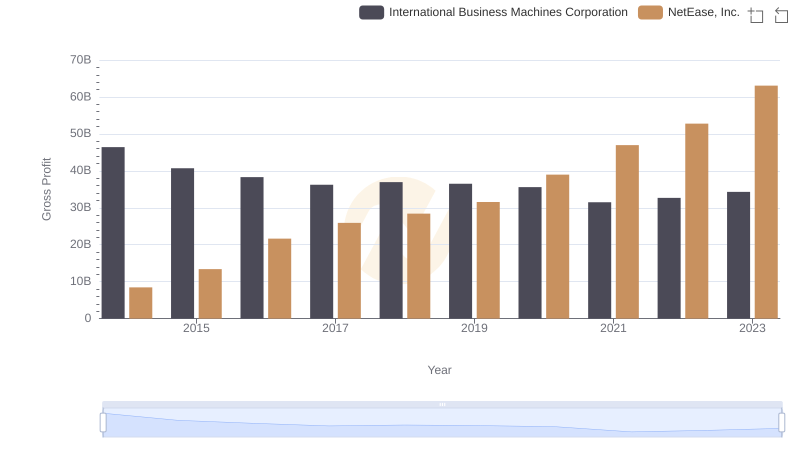
Gross Profit Analysis: Comparing International Business Machines Corporation and NetEase, Inc.
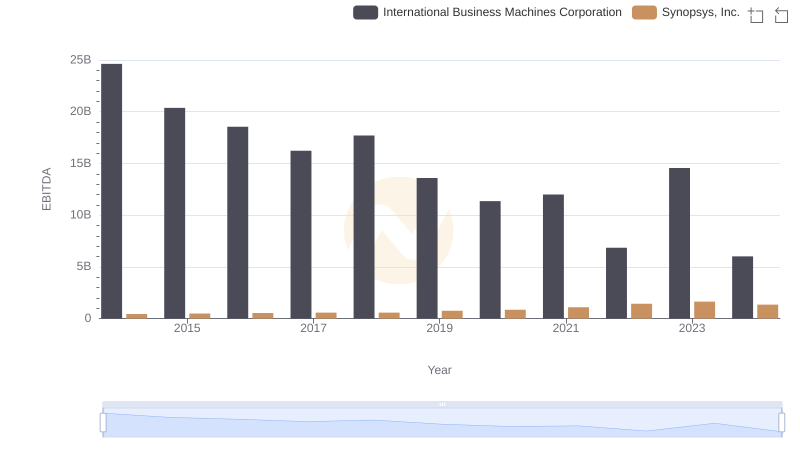
International Business Machines Corporation and Synopsys, Inc.: A Detailed Examination of EBITDA Performance
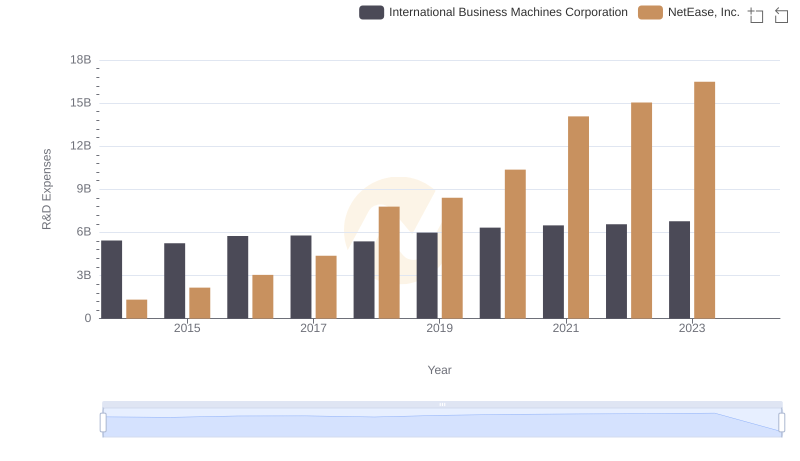
Who Prioritizes Innovation? R&D Spending Compared for International Business Machines Corporation and NetEase, Inc.
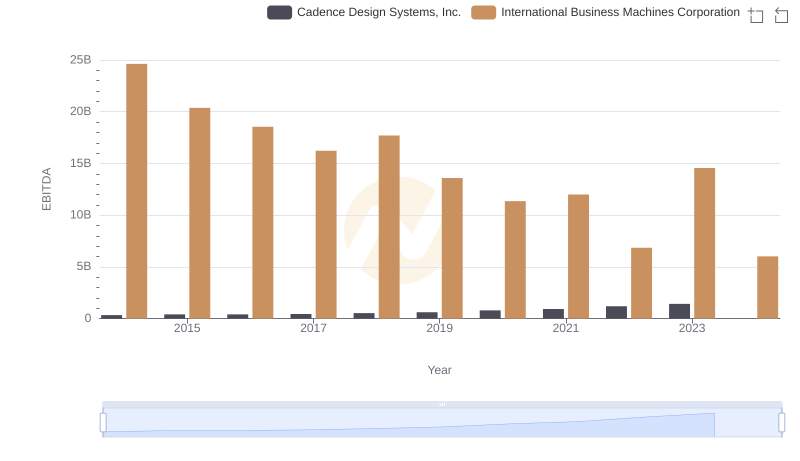
EBITDA Analysis: Evaluating International Business Machines Corporation Against Cadence Design Systems, Inc.
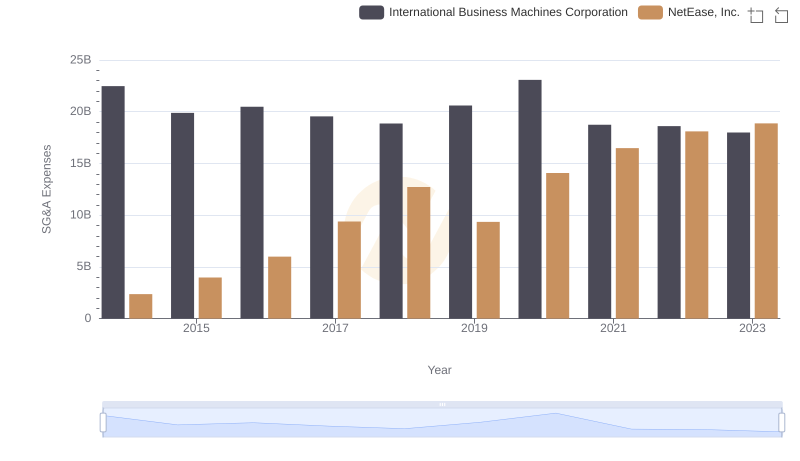
Cost Management Insights: SG&A Expenses for International Business Machines Corporation and NetEase, Inc.
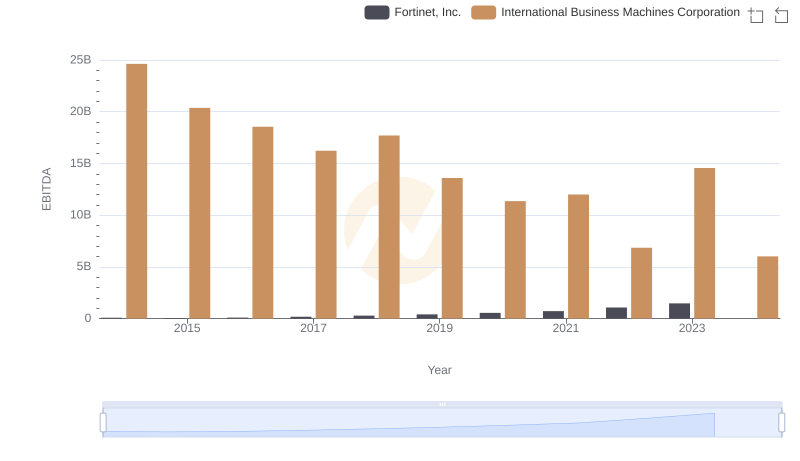
A Side-by-Side Analysis of EBITDA: International Business Machines Corporation and Fortinet, Inc.

International Business Machines Corporation and VMware, Inc.: A Detailed Examination of EBITDA Performance
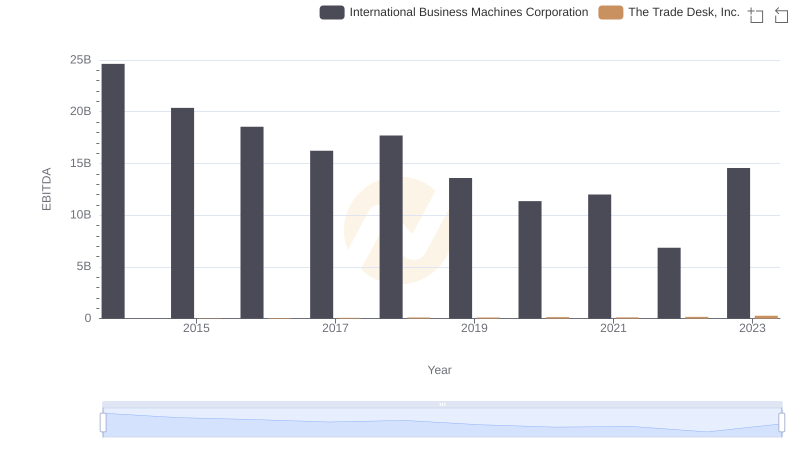
A Professional Review of EBITDA: International Business Machines Corporation Compared to The Trade Desk, Inc.
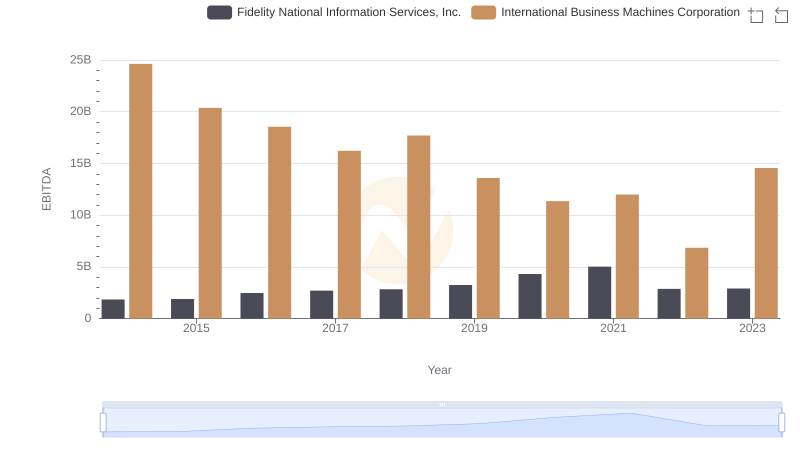
International Business Machines Corporation vs Fidelity National Information Services, Inc.: In-Depth EBITDA Performance Comparison
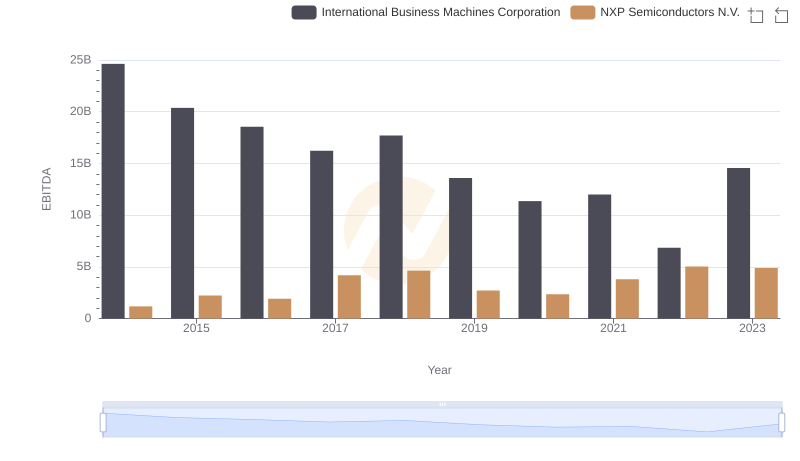
International Business Machines Corporation and NXP Semiconductors N.V.: A Detailed Examination of EBITDA Performance