| __timestamp | Fair Isaac Corporation | International Business Machines Corporation |
|---|---|---|
| Wednesday, January 1, 2014 | 194313000 | 24962000000 |
| Thursday, January 1, 2015 | 172277000 | 20268000000 |
| Friday, January 1, 2016 | 202993000 | 17341000000 |
| Sunday, January 1, 2017 | 213494000 | 16556000000 |
| Monday, January 1, 2018 | 218425000 | 16545000000 |
| Tuesday, January 1, 2019 | 287436000 | 14609000000 |
| Wednesday, January 1, 2020 | 349555000 | 10555000000 |
| Friday, January 1, 2021 | 554928000 | 12409000000 |
| Saturday, January 1, 2022 | 576663000 | 7174000000 |
| Sunday, January 1, 2023 | 663808000 | 14693000000 |
| Monday, January 1, 2024 | 761490000 | 6015000000 |
Data in motion
In the ever-evolving landscape of technology and finance, the EBITDA performance of International Business Machines Corporation (IBM) and Fair Isaac Corporation (FICO) offers a fascinating glimpse into their strategic trajectories over the past decade. From 2014 to 2024, IBM's EBITDA has seen a significant decline, dropping from a peak of approximately $24.6 billion in 2014 to around $6 billion in 2024. This represents a staggering 76% decrease, reflecting the challenges IBM faces in adapting to the rapidly changing tech environment.
Conversely, FICO has demonstrated a robust growth trajectory, with its EBITDA increasing by nearly 292% from 2014 to 2024. This growth underscores FICO's successful adaptation and innovation in the financial services sector. As we look to the future, these trends highlight the importance of agility and innovation in maintaining competitive advantage in the tech and finance industries.
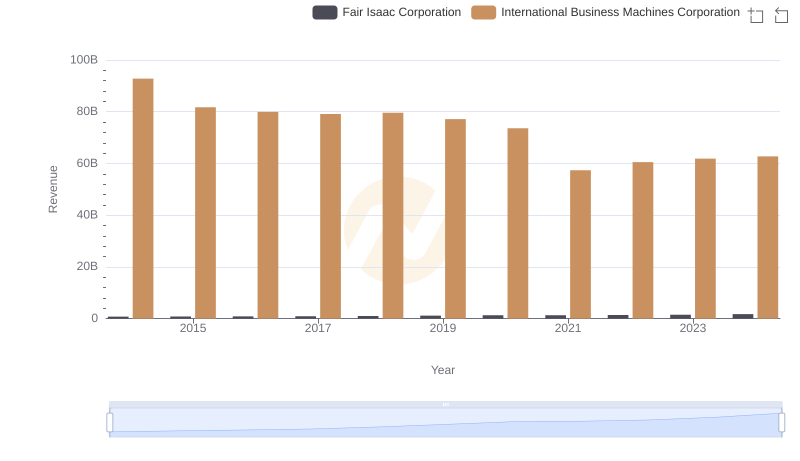
Revenue Showdown: International Business Machines Corporation vs Fair Isaac Corporation
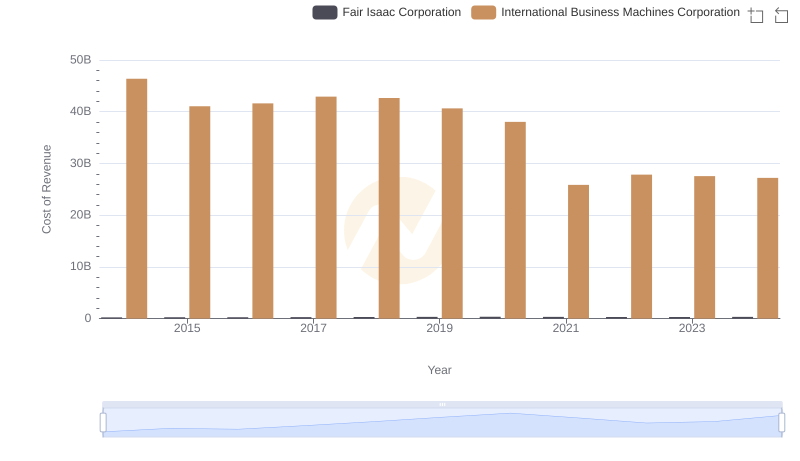
Cost of Revenue Trends: International Business Machines Corporation vs Fair Isaac Corporation
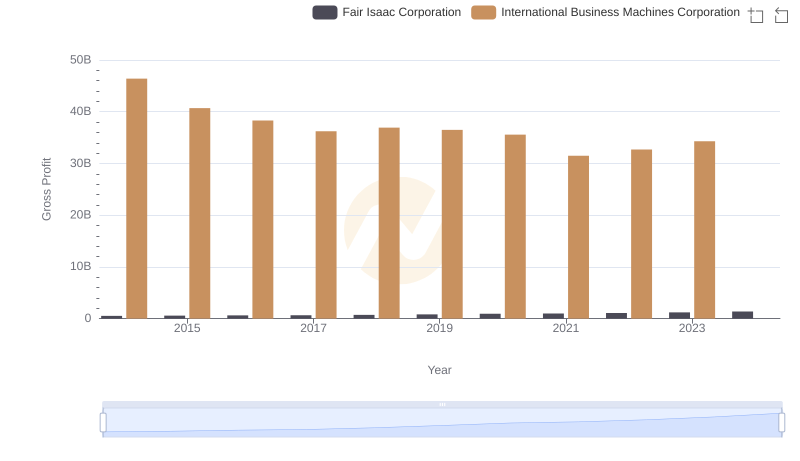
Who Generates Higher Gross Profit? International Business Machines Corporation or Fair Isaac Corporation
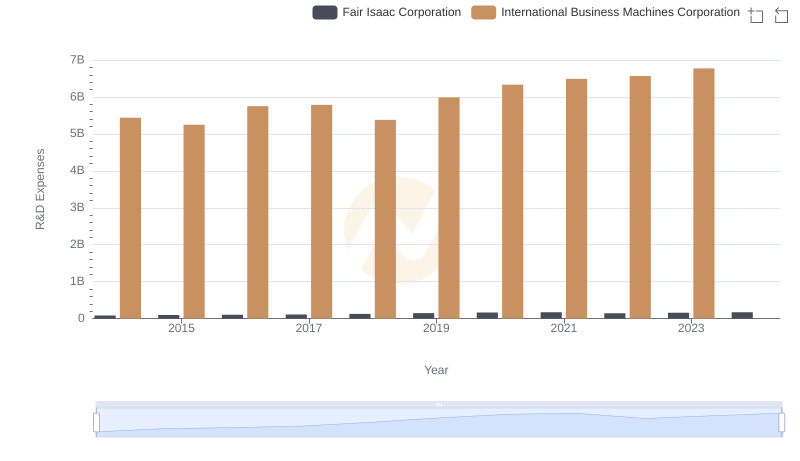
Who Prioritizes Innovation? R&D Spending Compared for International Business Machines Corporation and Fair Isaac Corporation
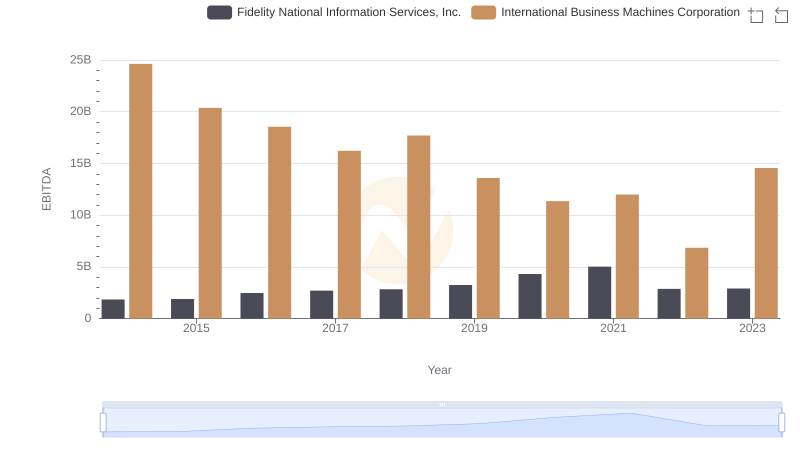
International Business Machines Corporation vs Fidelity National Information Services, Inc.: In-Depth EBITDA Performance Comparison
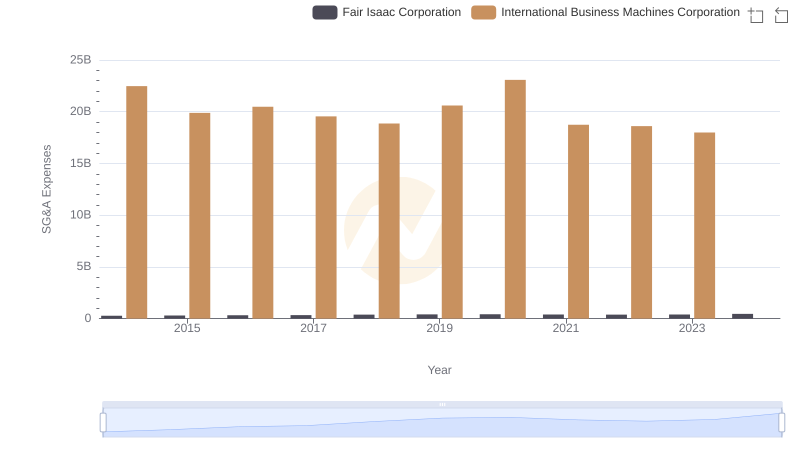
International Business Machines Corporation or Fair Isaac Corporation: Who Manages SG&A Costs Better?
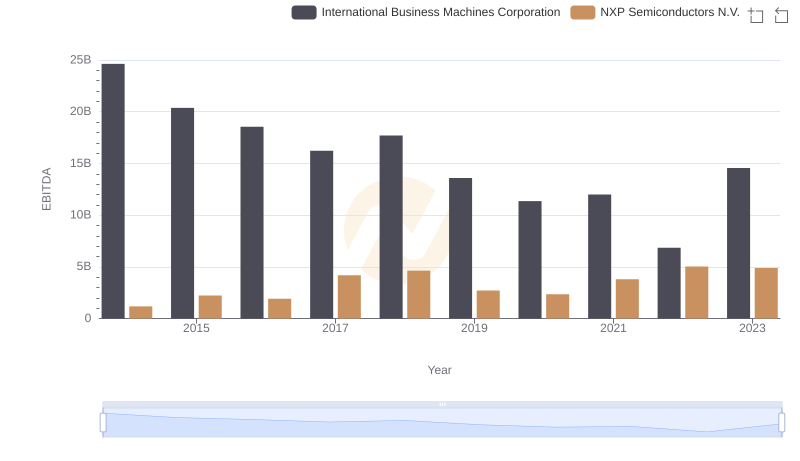
International Business Machines Corporation and NXP Semiconductors N.V.: A Detailed Examination of EBITDA Performance

International Business Machines Corporation vs Gartner, Inc.: In-Depth EBITDA Performance Comparison
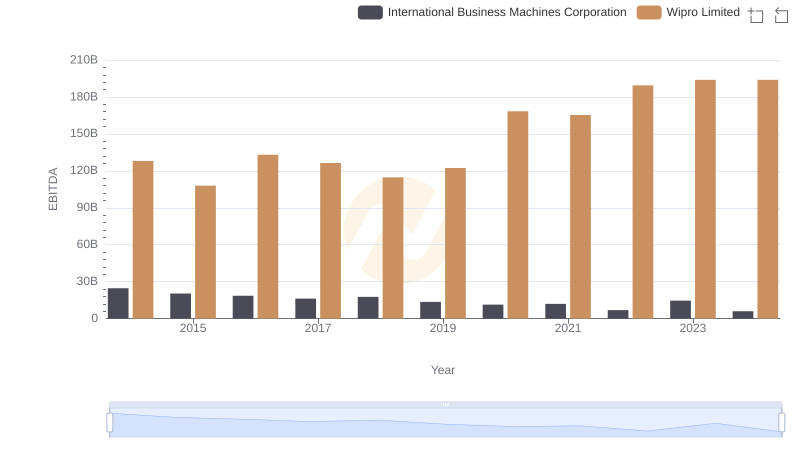
International Business Machines Corporation vs Wipro Limited: In-Depth EBITDA Performance Comparison
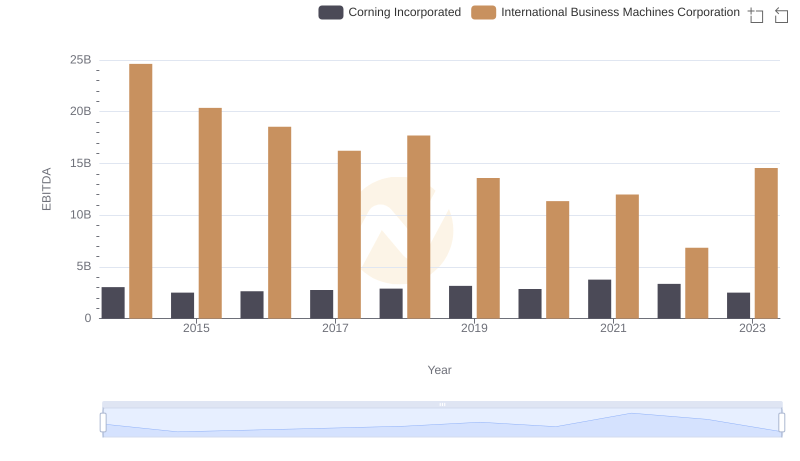
Comprehensive EBITDA Comparison: International Business Machines Corporation vs Corning Incorporated
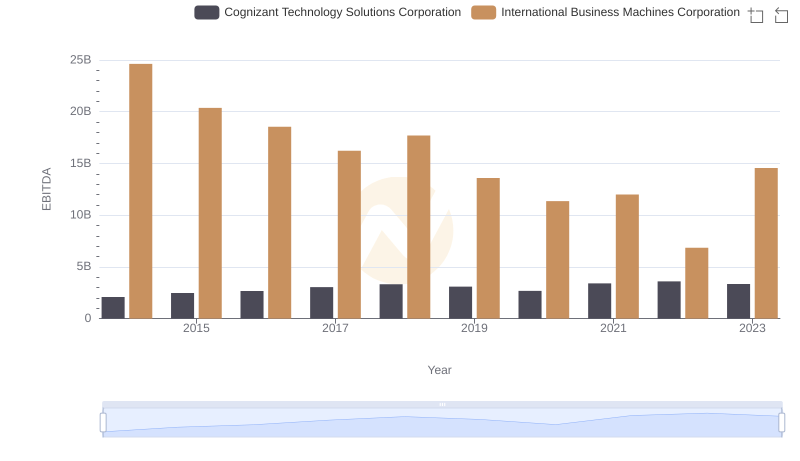
A Side-by-Side Analysis of EBITDA: International Business Machines Corporation and Cognizant Technology Solutions Corporation
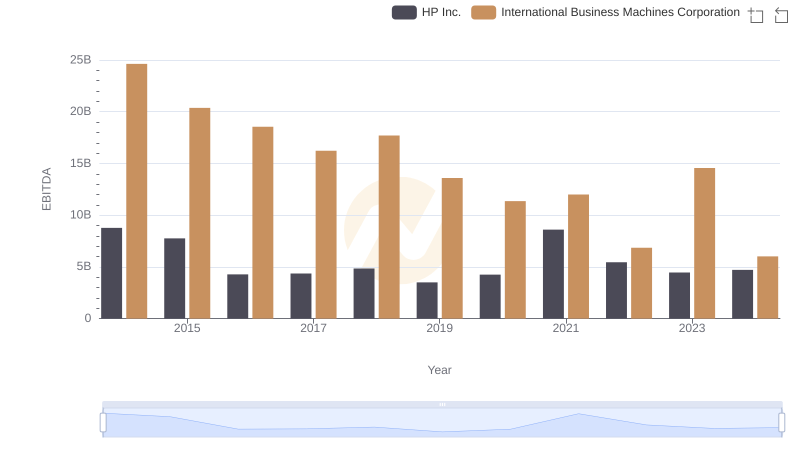
Professional EBITDA Benchmarking: International Business Machines Corporation vs HP Inc.