| __timestamp | International Business Machines Corporation | NXP Semiconductors N.V. |
|---|---|---|
| Wednesday, January 1, 2014 | 24962000000 | 1189000000 |
| Thursday, January 1, 2015 | 20268000000 | 2230000000 |
| Friday, January 1, 2016 | 17341000000 | 1921000000 |
| Sunday, January 1, 2017 | 16556000000 | 4196000000 |
| Monday, January 1, 2018 | 16545000000 | 4645000000 |
| Tuesday, January 1, 2019 | 14609000000 | 2719000000 |
| Wednesday, January 1, 2020 | 10555000000 | 2351000000 |
| Friday, January 1, 2021 | 12409000000 | 3811000000 |
| Saturday, January 1, 2022 | 7174000000 | 5040000000 |
| Sunday, January 1, 2023 | 14693000000 | 4896000000 |
| Monday, January 1, 2024 | 6015000000 |
Infusing magic into the data realm
In the ever-evolving landscape of technology, the financial performance of industry giants like International Business Machines Corporation (IBM) and NXP Semiconductors N.V. offers valuable insights. Over the past decade, IBM's EBITDA has shown a notable decline, dropping from its peak in 2014 to nearly half by 2024. This represents a significant contraction, highlighting the challenges faced by the company in adapting to new market dynamics.
Conversely, NXP Semiconductors has demonstrated a more resilient trajectory. Despite fluctuations, its EBITDA has grown by over 300% from 2014 to 2022, reflecting its strategic positioning in the semiconductor industry. However, data for 2024 remains unavailable, leaving room for speculation on future performance.
This analysis underscores the contrasting paths of these two tech titans, offering a glimpse into the broader trends shaping the technology sector.
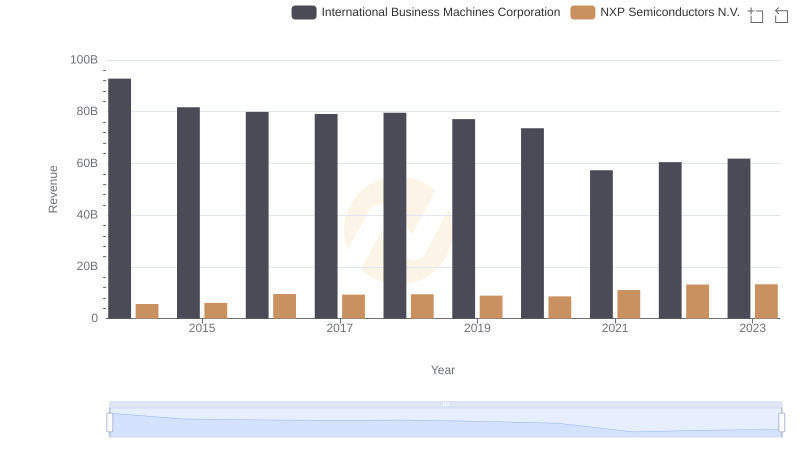
Comparing Revenue Performance: International Business Machines Corporation or NXP Semiconductors N.V.?
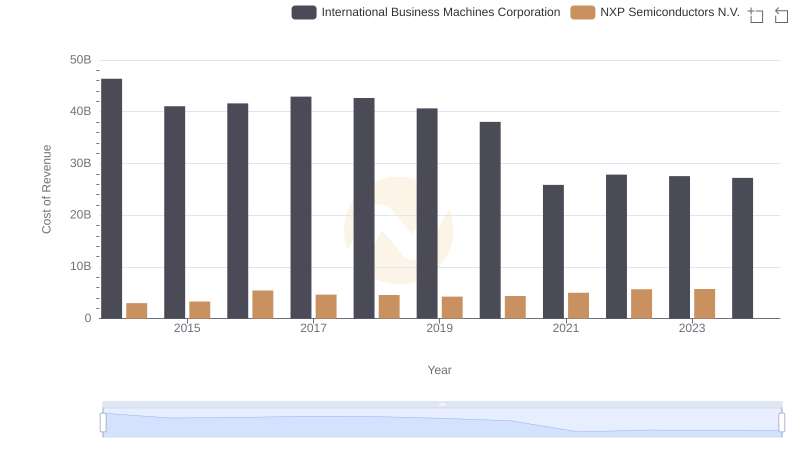
Cost of Revenue Comparison: International Business Machines Corporation vs NXP Semiconductors N.V.
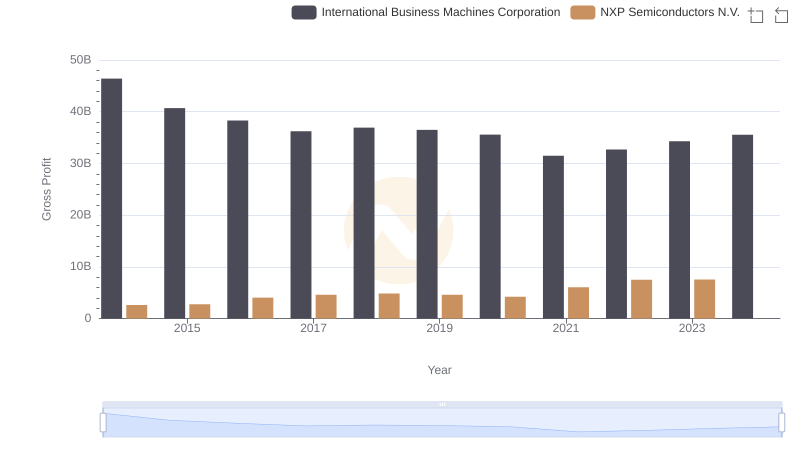
Gross Profit Comparison: International Business Machines Corporation and NXP Semiconductors N.V. Trends

R&D Insights: How International Business Machines Corporation and NXP Semiconductors N.V. Allocate Funds
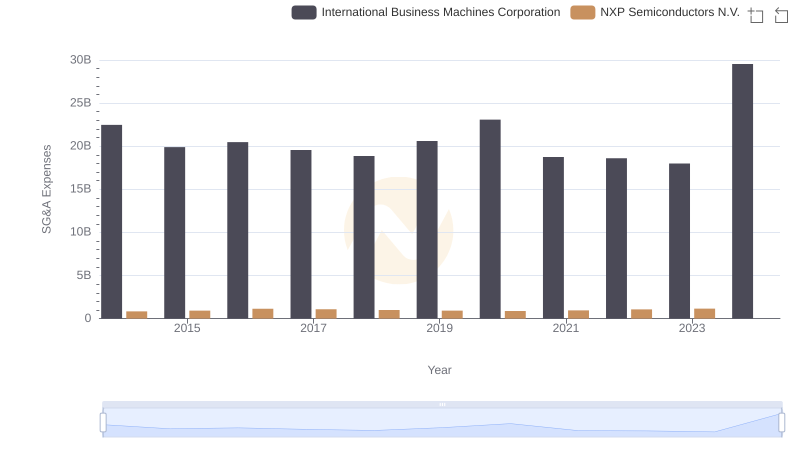
Selling, General, and Administrative Costs: International Business Machines Corporation vs NXP Semiconductors N.V.

International Business Machines Corporation and VMware, Inc.: A Detailed Examination of EBITDA Performance
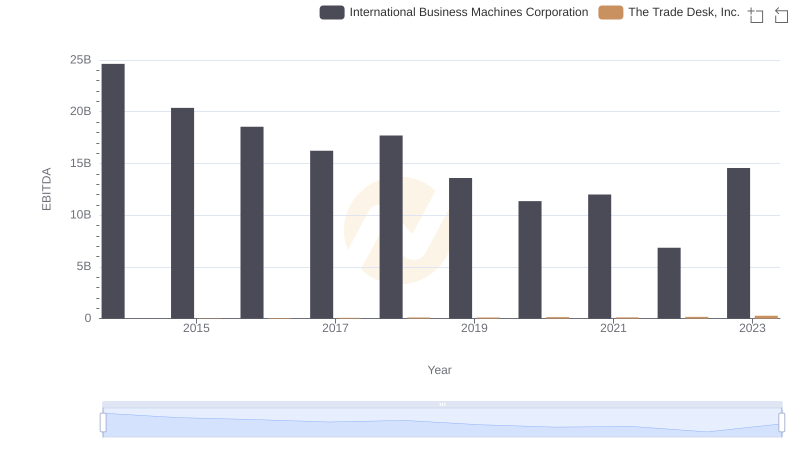
A Professional Review of EBITDA: International Business Machines Corporation Compared to The Trade Desk, Inc.
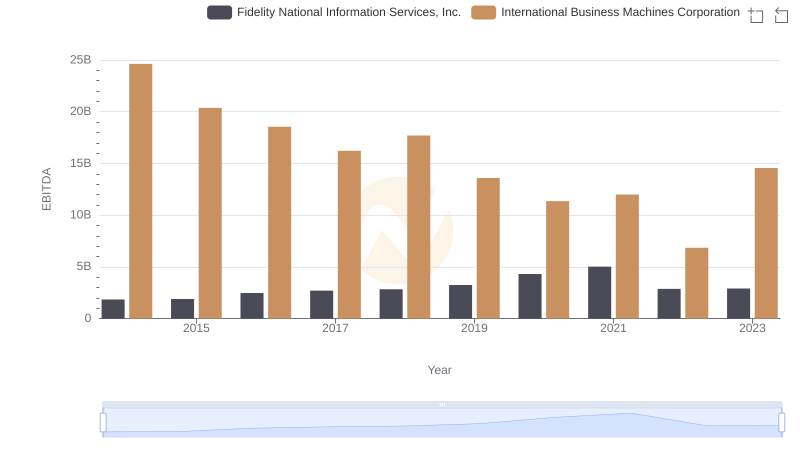
International Business Machines Corporation vs Fidelity National Information Services, Inc.: In-Depth EBITDA Performance Comparison
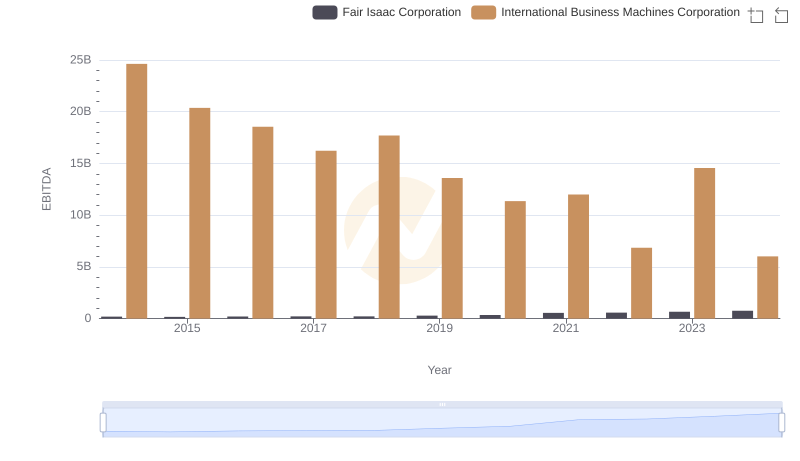
EBITDA Metrics Evaluated: International Business Machines Corporation vs Fair Isaac Corporation

International Business Machines Corporation vs Gartner, Inc.: In-Depth EBITDA Performance Comparison
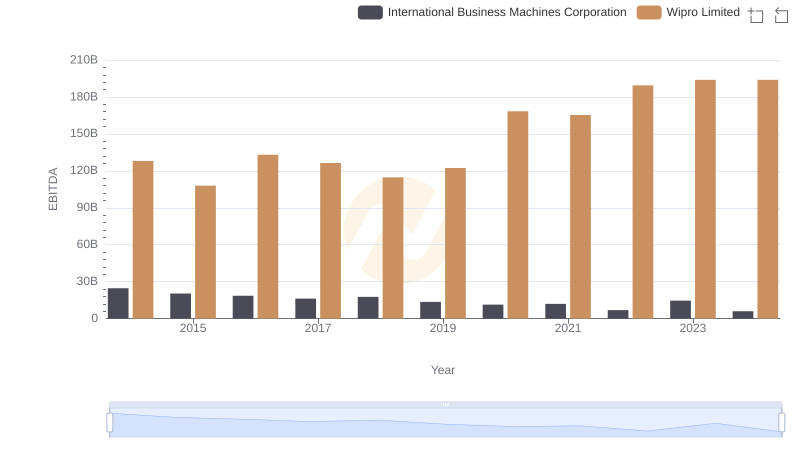
International Business Machines Corporation vs Wipro Limited: In-Depth EBITDA Performance Comparison
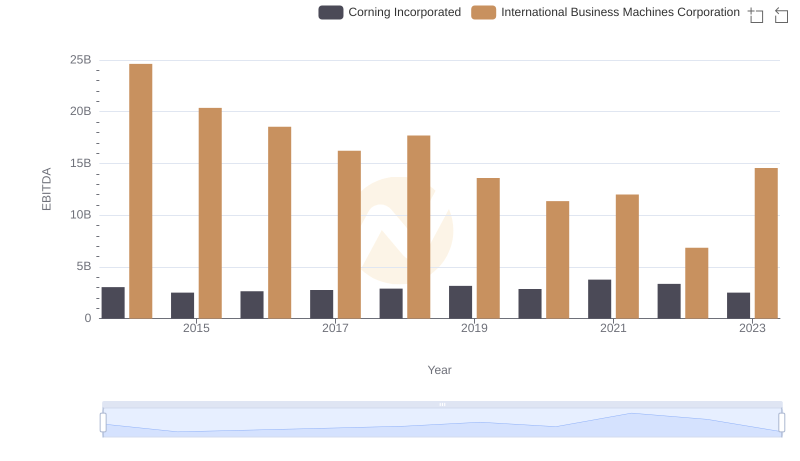
Comprehensive EBITDA Comparison: International Business Machines Corporation vs Corning Incorporated