| __timestamp | Cadence Design Systems, Inc. | International Business Machines Corporation |
|---|---|---|
| Wednesday, January 1, 2014 | 332530000 | 24962000000 |
| Thursday, January 1, 2015 | 408806000 | 20268000000 |
| Friday, January 1, 2016 | 406544000 | 17341000000 |
| Sunday, January 1, 2017 | 448885000 | 16556000000 |
| Monday, January 1, 2018 | 526019000 | 16545000000 |
| Tuesday, January 1, 2019 | 620586000 | 14609000000 |
| Wednesday, January 1, 2020 | 799150000 | 10555000000 |
| Friday, January 1, 2021 | 927723000 | 12409000000 |
| Saturday, January 1, 2022 | 1200385000 | 7174000000 |
| Sunday, January 1, 2023 | 1419630000 | 14693000000 |
| Monday, January 1, 2024 | 1350763000 | 6015000000 |
Data in motion
In the ever-evolving landscape of technology, the financial performance of industry leaders like International Business Machines Corporation (IBM) and Cadence Design Systems, Inc. offers a fascinating glimpse into their strategic trajectories. Over the past decade, IBM's EBITDA has shown a fluctuating trend, peaking in 2014 and experiencing a notable dip by 2022, reflecting a 72% decrease. In contrast, Cadence Design Systems has demonstrated a robust upward trajectory, with its EBITDA growing by over 300% from 2014 to 2023. This divergence highlights the dynamic nature of the tech industry, where adaptability and innovation are key. While IBM's recent figures suggest a need for strategic recalibration, Cadence's consistent growth underscores its successful navigation of market demands. As we look to the future, these trends offer valuable insights into the competitive strategies shaping the tech world.
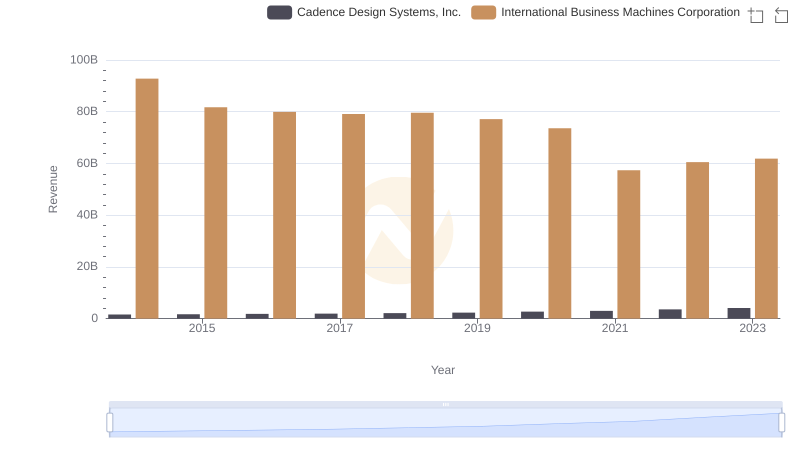
International Business Machines Corporation or Cadence Design Systems, Inc.: Who Leads in Yearly Revenue?
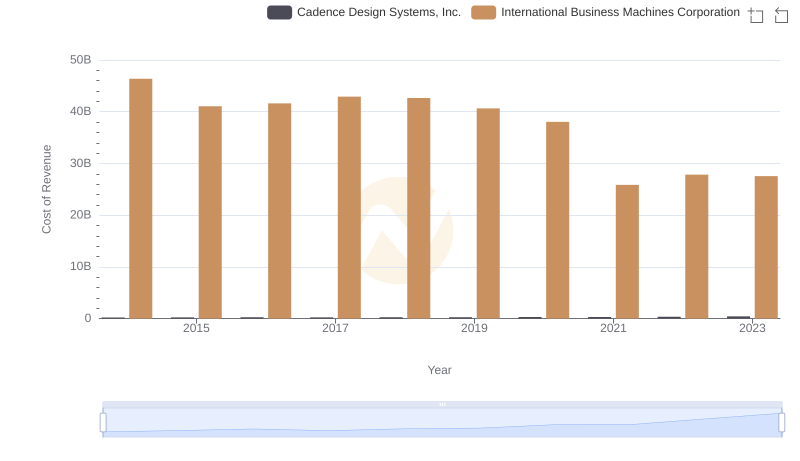
Cost of Revenue Comparison: International Business Machines Corporation vs Cadence Design Systems, Inc.
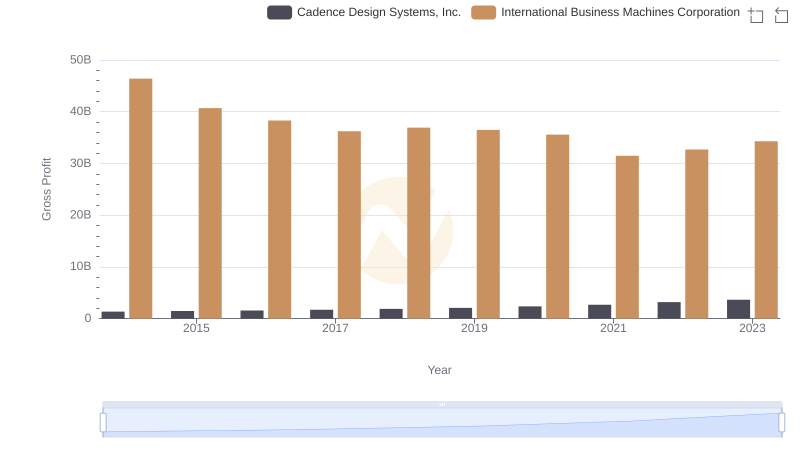
Gross Profit Analysis: Comparing International Business Machines Corporation and Cadence Design Systems, Inc.
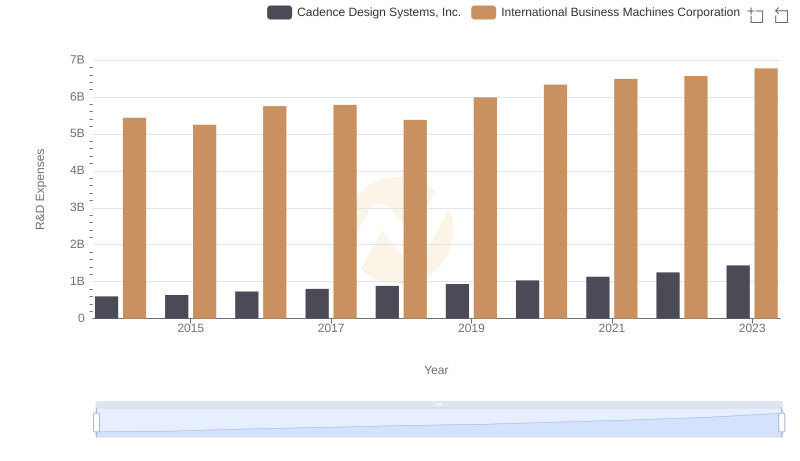
International Business Machines Corporation or Cadence Design Systems, Inc.: Who Invests More in Innovation?
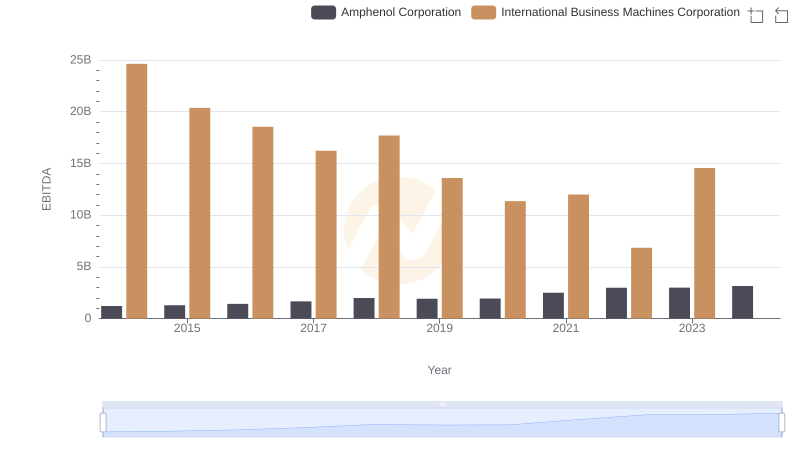
A Side-by-Side Analysis of EBITDA: International Business Machines Corporation and Amphenol Corporation
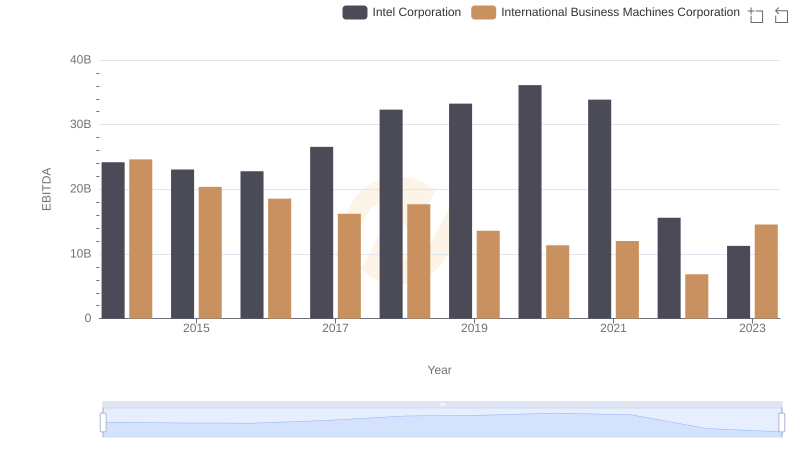
Comparative EBITDA Analysis: International Business Machines Corporation vs Intel Corporation
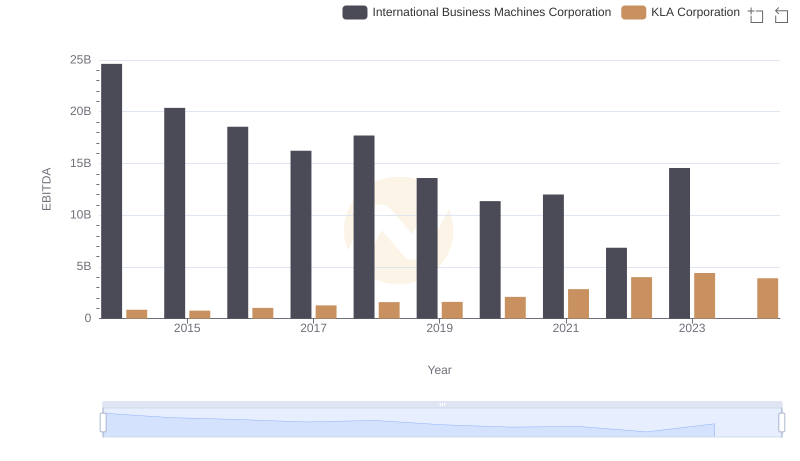
EBITDA Metrics Evaluated: International Business Machines Corporation vs KLA Corporation
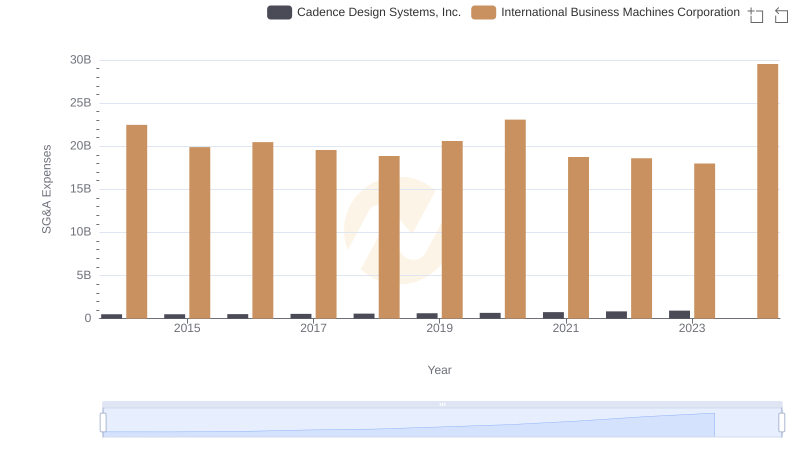
Cost Management Insights: SG&A Expenses for International Business Machines Corporation and Cadence Design Systems, Inc.
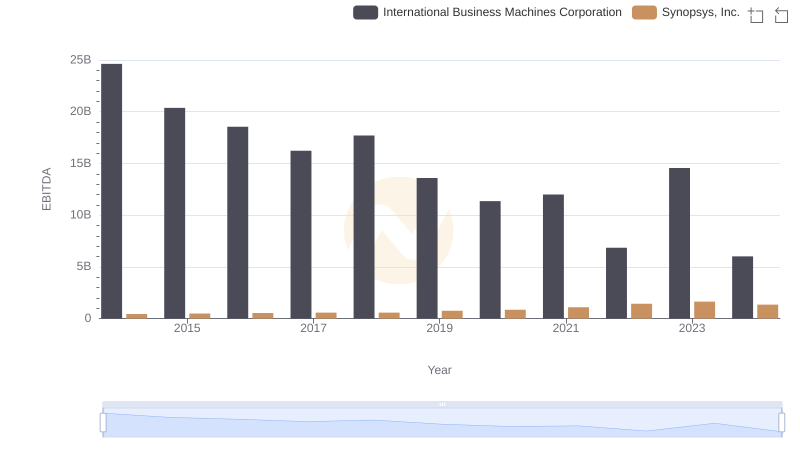
International Business Machines Corporation and Synopsys, Inc.: A Detailed Examination of EBITDA Performance
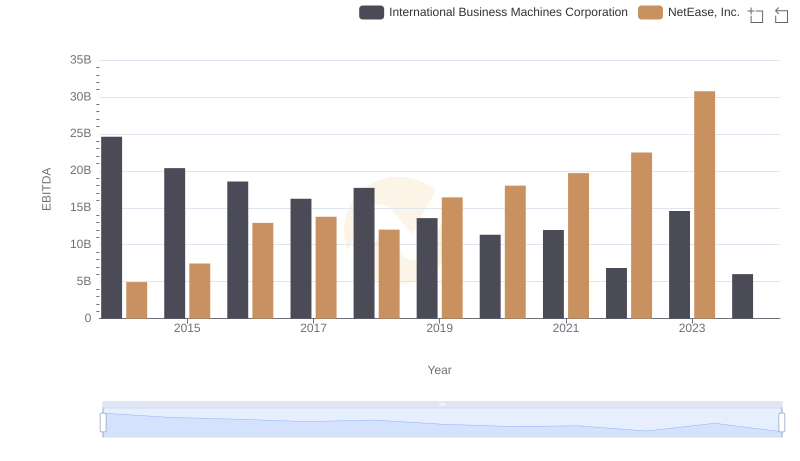
A Professional Review of EBITDA: International Business Machines Corporation Compared to NetEase, Inc.
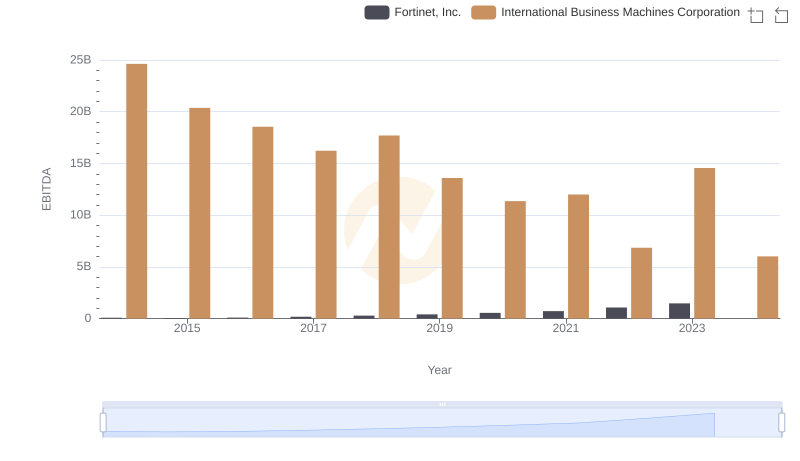
A Side-by-Side Analysis of EBITDA: International Business Machines Corporation and Fortinet, Inc.

International Business Machines Corporation and VMware, Inc.: A Detailed Examination of EBITDA Performance