| __timestamp | International Business Machines Corporation | The Trade Desk, Inc. |
|---|---|---|
| Wednesday, January 1, 2014 | 24962000000 | 580000 |
| Thursday, January 1, 2015 | 20268000000 | 32824000 |
| Friday, January 1, 2016 | 17341000000 | 61316000 |
| Sunday, January 1, 2017 | 16556000000 | 76565000 |
| Monday, January 1, 2018 | 16545000000 | 107323000 |
| Tuesday, January 1, 2019 | 14609000000 | 112196000 |
| Wednesday, January 1, 2020 | 10555000000 | 144208000 |
| Friday, January 1, 2021 | 12409000000 | 124817000 |
| Saturday, January 1, 2022 | 7174000000 | 168079000 |
| Sunday, January 1, 2023 | 14693000000 | 280898000 |
| Monday, January 1, 2024 | 6015000000 | 427167000 |
Unlocking the unknown
In the ever-evolving landscape of technology, understanding financial health is crucial. This analysis delves into the EBITDA performance of two industry giants: International Business Machines Corporation (IBM) and The Trade Desk, Inc. Over the past decade, IBM has consistently demonstrated robust EBITDA figures, peaking in 2014 with a staggering 24.6 billion USD. However, a downward trend is evident, with a notable dip to 6 billion USD in 2024. In contrast, The Trade Desk, a rising star in digital advertising, has shown impressive growth. From a modest 580,000 USD in 2014, it surged to nearly 281 million USD by 2023, marking an exponential increase. This juxtaposition highlights IBM's established dominance and The Trade Desk's rapid ascent. Missing data for 2024 suggests potential volatility or strategic shifts. Investors should watch these trends closely as they reflect broader market dynamics.
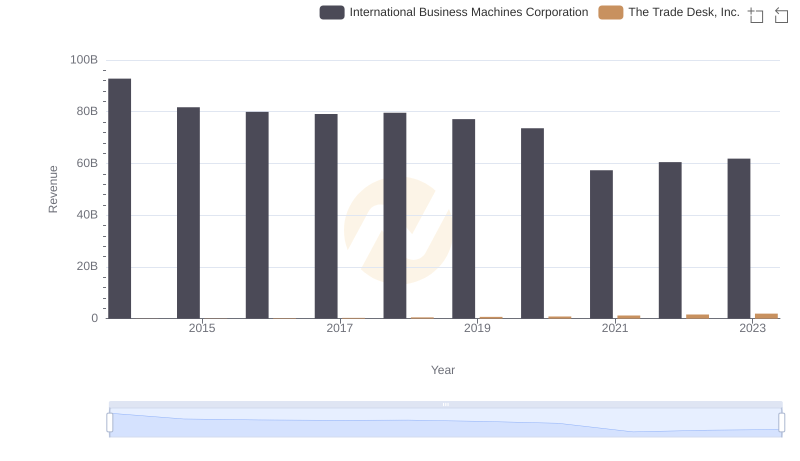
International Business Machines Corporation and The Trade Desk, Inc.: A Comprehensive Revenue Analysis
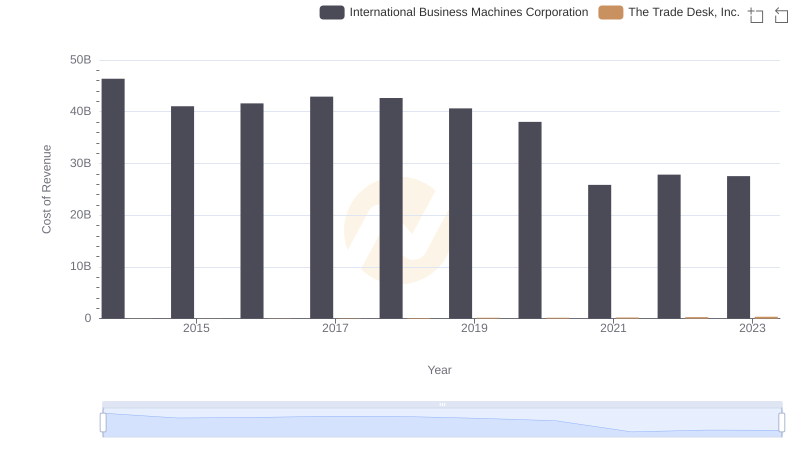
Cost Insights: Breaking Down International Business Machines Corporation and The Trade Desk, Inc.'s Expenses
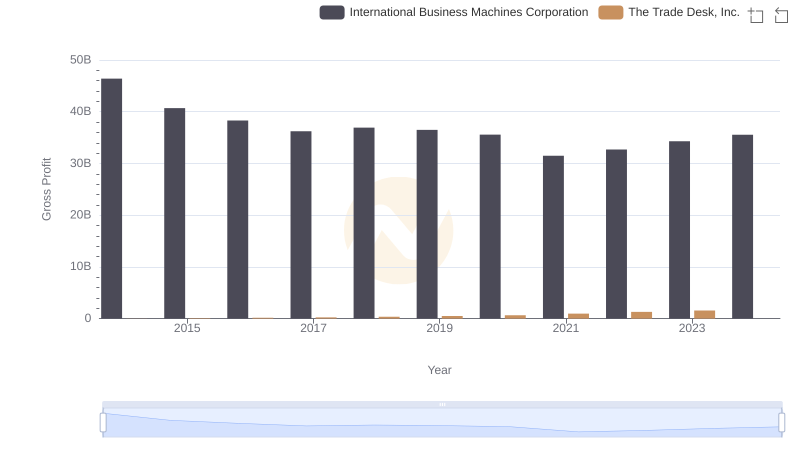
Key Insights on Gross Profit: International Business Machines Corporation vs The Trade Desk, Inc.

Comparing Innovation Spending: International Business Machines Corporation and The Trade Desk, Inc.
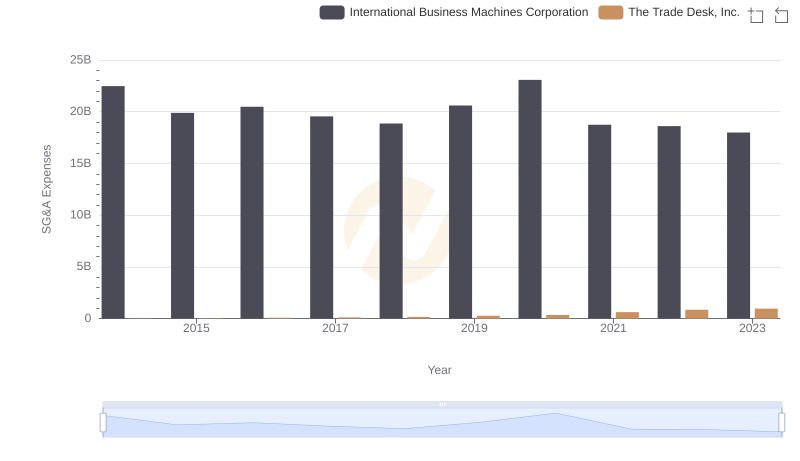
Operational Costs Compared: SG&A Analysis of International Business Machines Corporation and The Trade Desk, Inc.
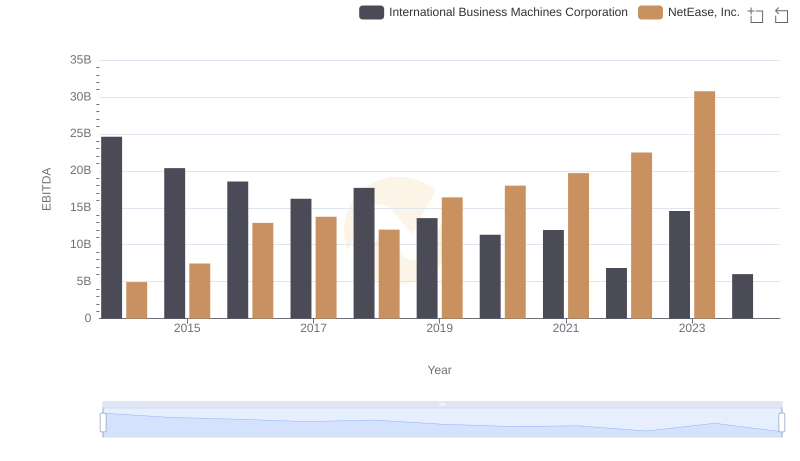
A Professional Review of EBITDA: International Business Machines Corporation Compared to NetEase, Inc.
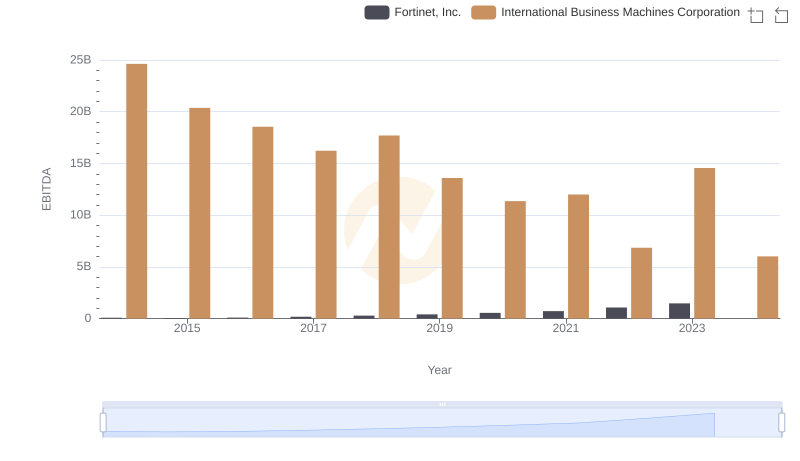
A Side-by-Side Analysis of EBITDA: International Business Machines Corporation and Fortinet, Inc.

International Business Machines Corporation and VMware, Inc.: A Detailed Examination of EBITDA Performance
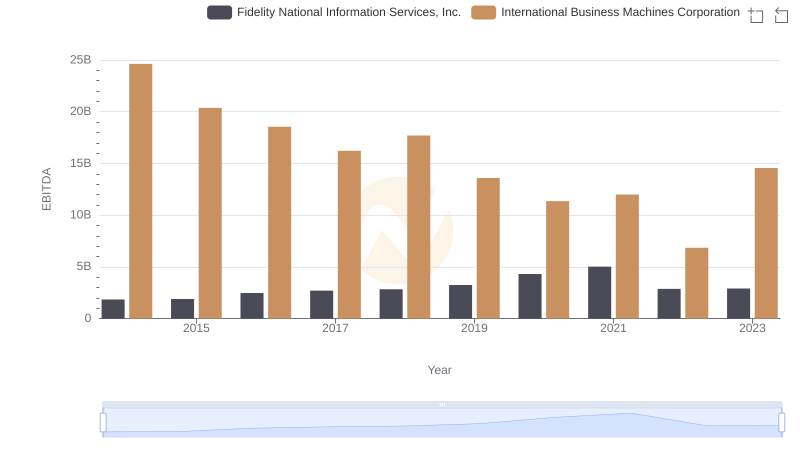
International Business Machines Corporation vs Fidelity National Information Services, Inc.: In-Depth EBITDA Performance Comparison
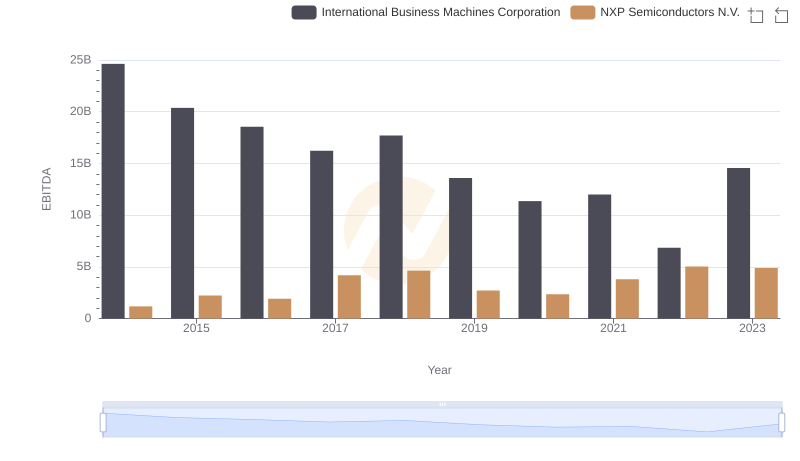
International Business Machines Corporation and NXP Semiconductors N.V.: A Detailed Examination of EBITDA Performance
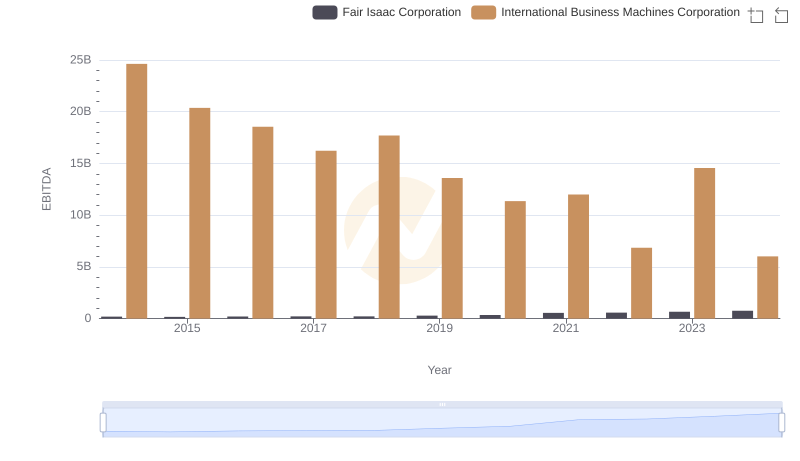
EBITDA Metrics Evaluated: International Business Machines Corporation vs Fair Isaac Corporation

International Business Machines Corporation vs Gartner, Inc.: In-Depth EBITDA Performance Comparison