| __timestamp | Broadridge Financial Solutions, Inc. | International Business Machines Corporation |
|---|---|---|
| Wednesday, January 1, 2014 | 1761400000 | 46386000000 |
| Thursday, January 1, 2015 | 1828200000 | 41057000000 |
| Friday, January 1, 2016 | 1975900000 | 41403000000 |
| Sunday, January 1, 2017 | 3109600000 | 42196000000 |
| Monday, January 1, 2018 | 3169600000 | 42655000000 |
| Tuesday, January 1, 2019 | 3131900000 | 26181000000 |
| Wednesday, January 1, 2020 | 3265100000 | 24314000000 |
| Friday, January 1, 2021 | 3570800000 | 25865000000 |
| Saturday, January 1, 2022 | 4116900000 | 27842000000 |
| Sunday, January 1, 2023 | 4275500000 | 27560000000 |
| Monday, January 1, 2024 | 4572900000 | 27202000000 |
Data in motion
In the ever-evolving landscape of technology and financial services, understanding the cost dynamics of industry giants like International Business Machines Corporation (IBM) and Broadridge Financial Solutions, Inc. is crucial. Over the past decade, from 2014 to 2024, IBM's cost of revenue has seen a significant decline of approximately 41%, dropping from 46.4 billion to 27.2 billion. This trend reflects IBM's strategic shift towards more efficient operations and possibly a focus on higher-margin services.
Conversely, Broadridge Financial Solutions has experienced a robust growth in its cost of revenue, increasing by nearly 160% from 1.8 billion to 4.6 billion. This surge indicates Broadridge's expansion and scaling efforts in the financial technology sector. The contrasting trajectories of these two companies highlight the diverse strategies employed in managing operational costs and adapting to market demands.
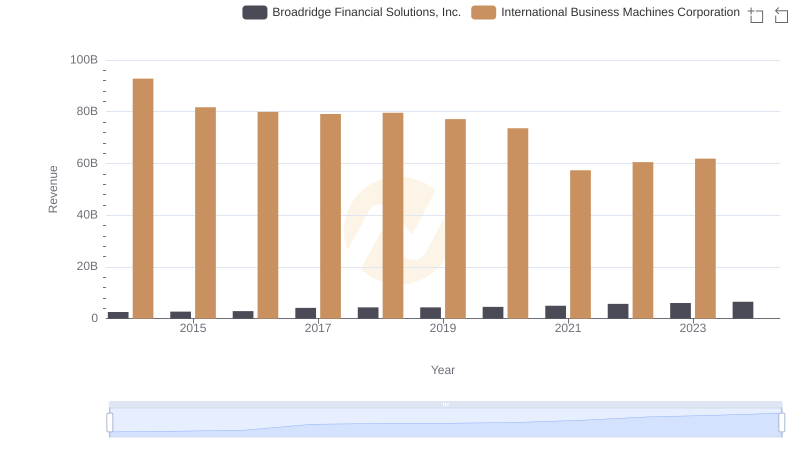
Revenue Insights: International Business Machines Corporation and Broadridge Financial Solutions, Inc. Performance Compared
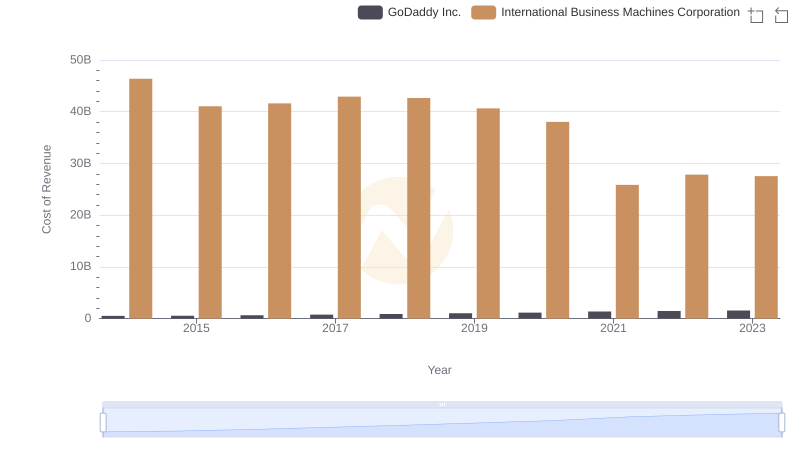
Cost Insights: Breaking Down International Business Machines Corporation and GoDaddy Inc.'s Expenses
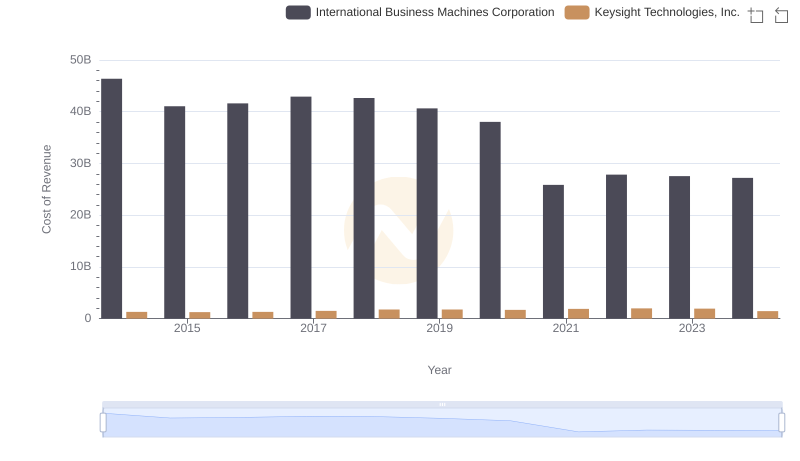
Cost of Revenue Trends: International Business Machines Corporation vs Keysight Technologies, Inc.
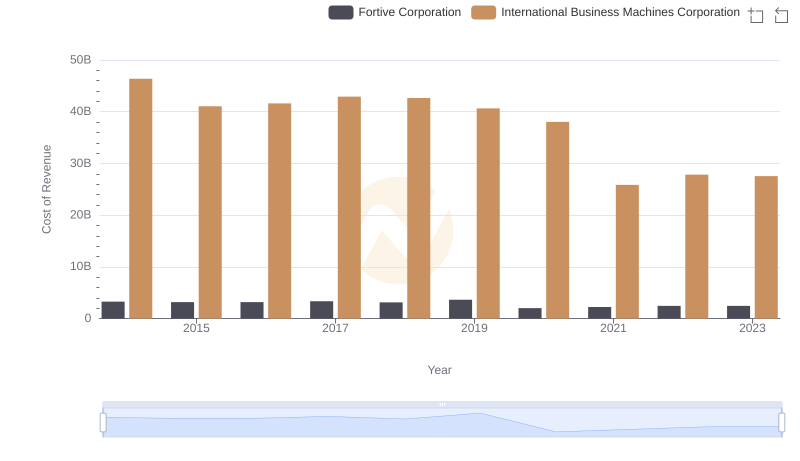
Cost of Revenue Comparison: International Business Machines Corporation vs Fortive Corporation
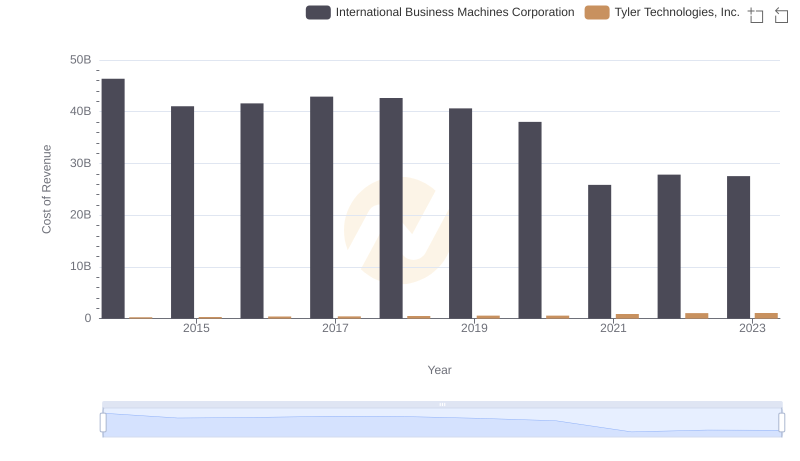
Cost of Revenue: Key Insights for International Business Machines Corporation and Tyler Technologies, Inc.
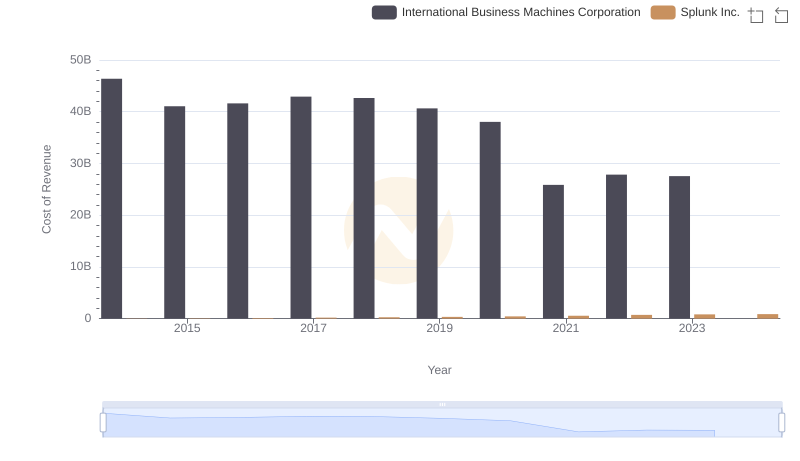
Cost of Revenue Comparison: International Business Machines Corporation vs Splunk Inc.
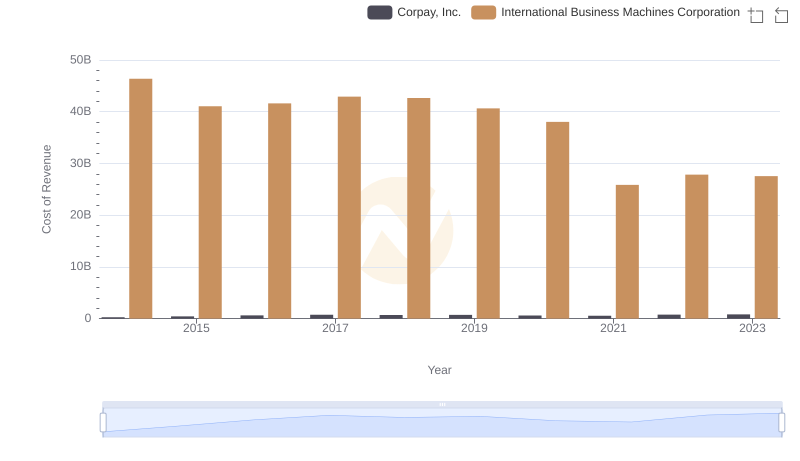
Analyzing Cost of Revenue: International Business Machines Corporation and Corpay, Inc.
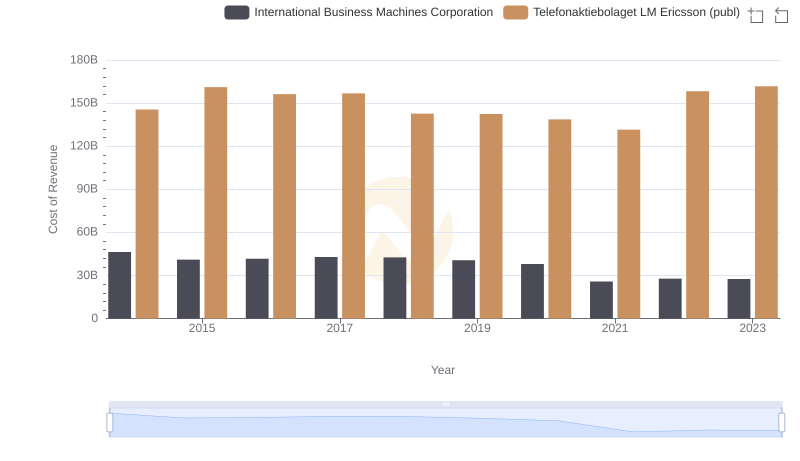
Cost of Revenue Trends: International Business Machines Corporation vs Telefonaktiebolaget LM Ericsson (publ)
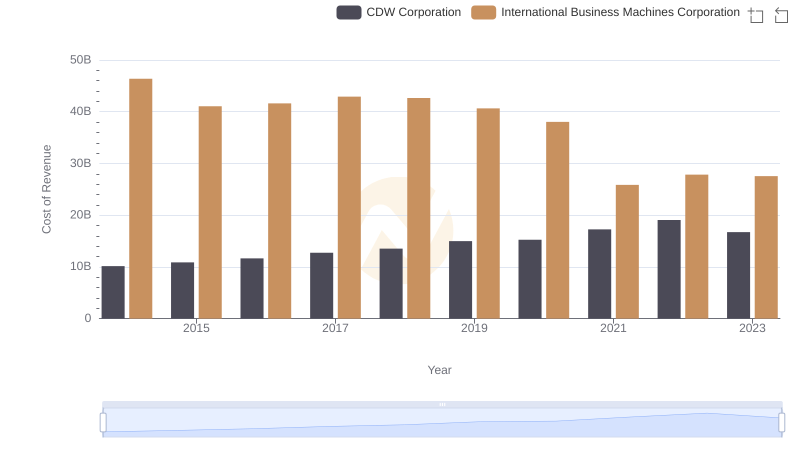
Analyzing Cost of Revenue: International Business Machines Corporation and CDW Corporation
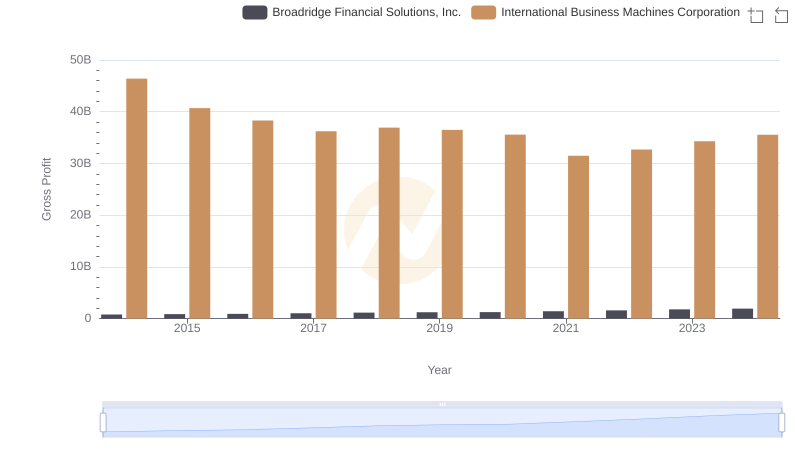
Gross Profit Trends Compared: International Business Machines Corporation vs Broadridge Financial Solutions, Inc.
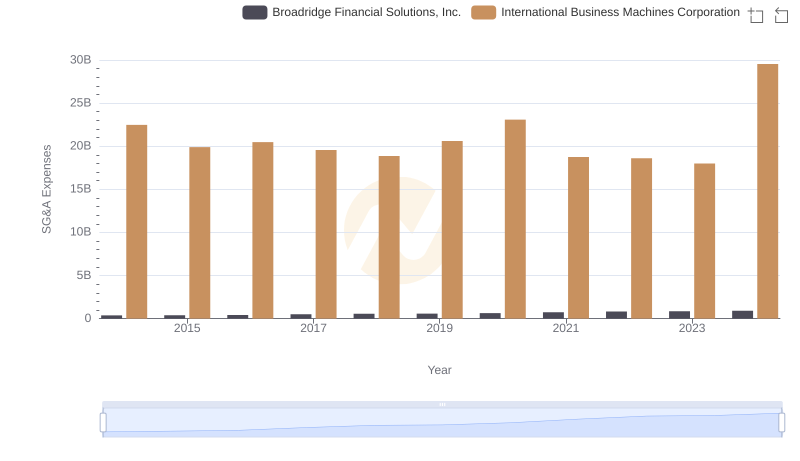
Operational Costs Compared: SG&A Analysis of International Business Machines Corporation and Broadridge Financial Solutions, Inc.
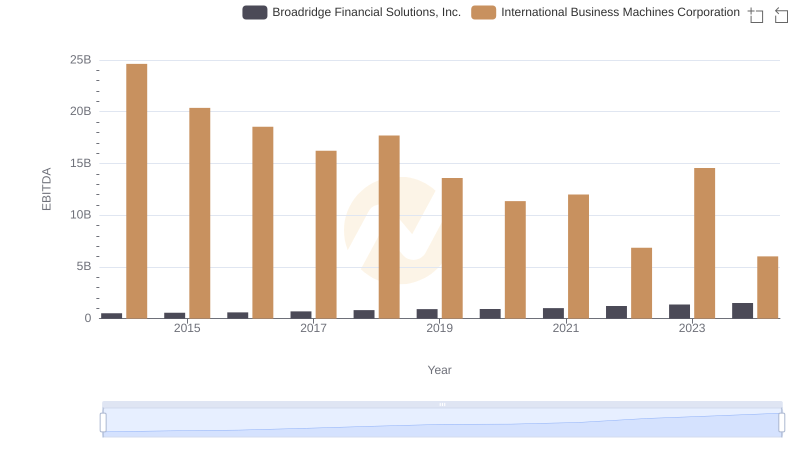
International Business Machines Corporation and Broadridge Financial Solutions, Inc.: A Detailed Examination of EBITDA Performance