| __timestamp | Broadridge Financial Solutions, Inc. | International Business Machines Corporation |
|---|---|---|
| Wednesday, January 1, 2014 | 796600000 | 46407000000 |
| Thursday, January 1, 2015 | 866000000 | 40684000000 |
| Friday, January 1, 2016 | 921100000 | 38516000000 |
| Sunday, January 1, 2017 | 1033000000 | 36943000000 |
| Monday, January 1, 2018 | 1160300000 | 36936000000 |
| Tuesday, January 1, 2019 | 1230300000 | 31533000000 |
| Wednesday, January 1, 2020 | 1263900000 | 30865000000 |
| Friday, January 1, 2021 | 1422900000 | 31486000000 |
| Saturday, January 1, 2022 | 1592200000 | 32687000000 |
| Sunday, January 1, 2023 | 1785400000 | 34300000000 |
| Monday, January 1, 2024 | 1933900000 | 35551000000 |
Igniting the spark of knowledge
In the ever-evolving landscape of technology and financial services, understanding the financial health of industry giants is crucial. Over the past decade, International Business Machines Corporation (IBM) and Broadridge Financial Solutions, Inc. have showcased distinct trajectories in their gross profit trends. From 2014 to 2024, IBM's gross profit has seen a decline of approximately 23%, dropping from a peak in 2014 to a more modest figure in 2024. In contrast, Broadridge has experienced a robust growth of nearly 143% over the same period, reflecting its strategic expansion and adaptation to market demands.
This divergence highlights the shifting dynamics within the tech and financial sectors. While IBM remains a stalwart with substantial profits, Broadridge's consistent upward trend underscores its growing influence and adaptability. As we look to the future, these trends offer valuable insights into the competitive landscape and potential investment opportunities.
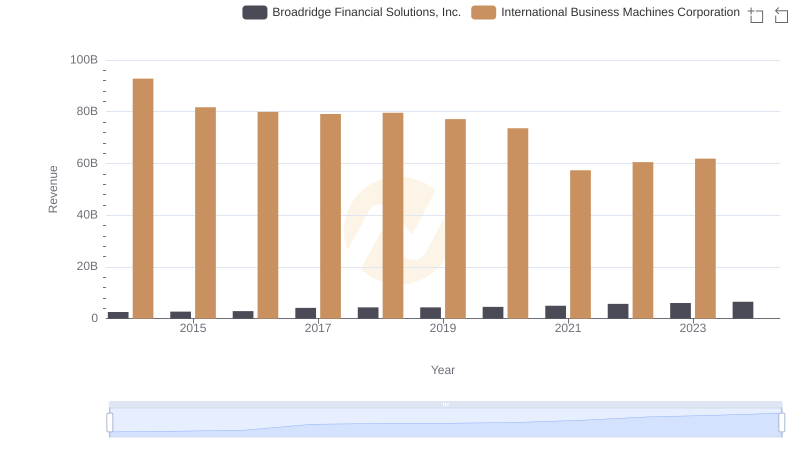
Revenue Insights: International Business Machines Corporation and Broadridge Financial Solutions, Inc. Performance Compared
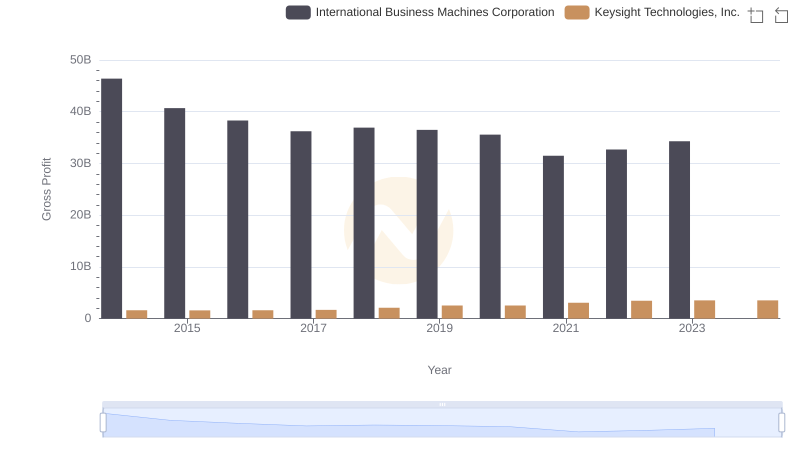
International Business Machines Corporation and Keysight Technologies, Inc.: A Detailed Gross Profit Analysis

Analyzing Cost of Revenue: International Business Machines Corporation and Broadridge Financial Solutions, Inc.
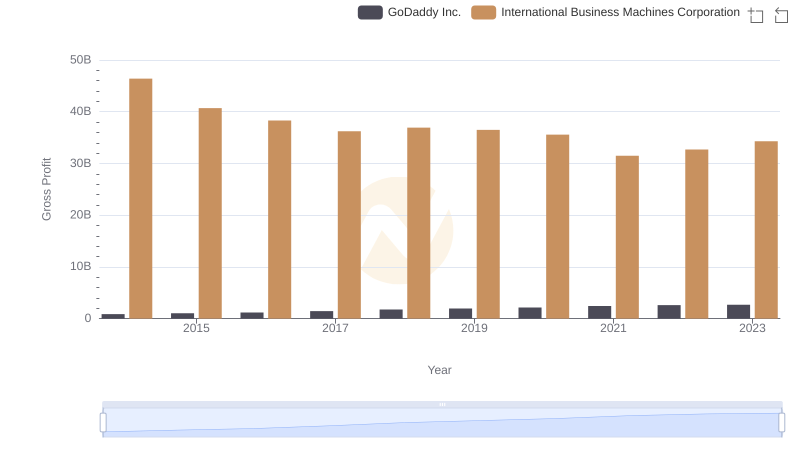
Gross Profit Comparison: International Business Machines Corporation and GoDaddy Inc. Trends
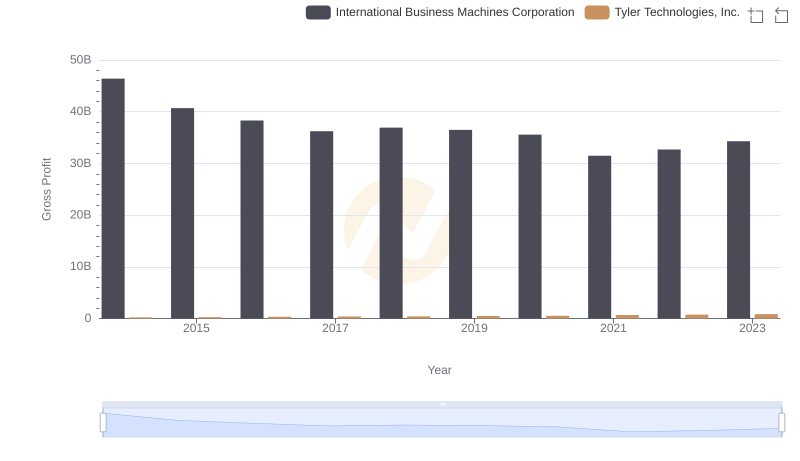
Gross Profit Analysis: Comparing International Business Machines Corporation and Tyler Technologies, Inc.
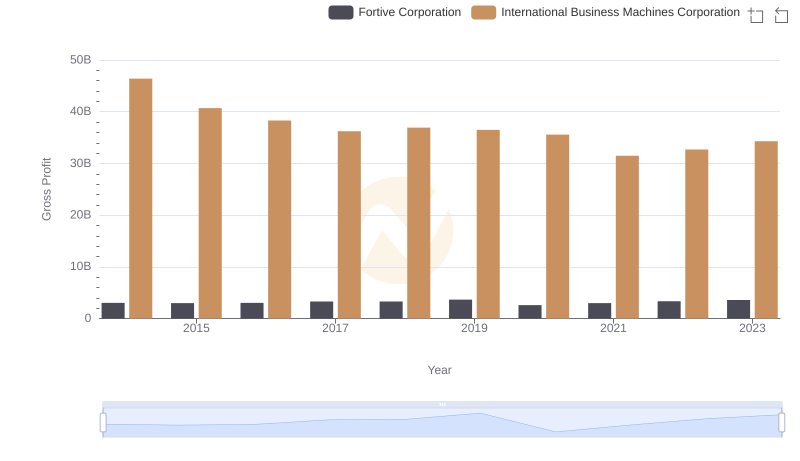
International Business Machines Corporation and Fortive Corporation: A Detailed Gross Profit Analysis
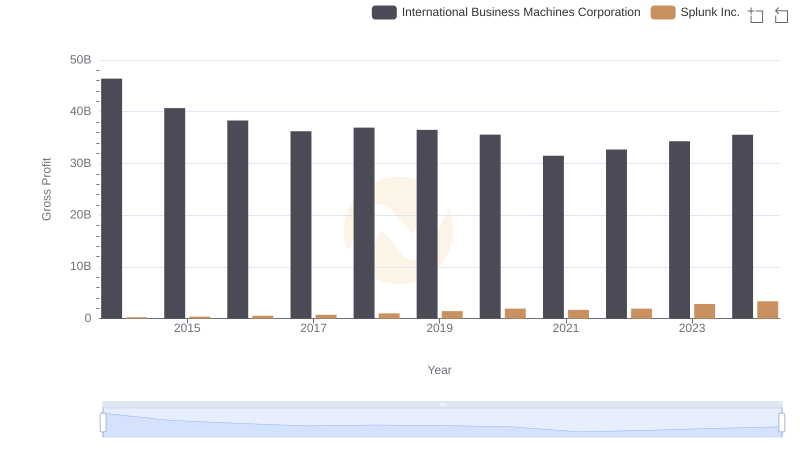
Gross Profit Trends Compared: International Business Machines Corporation vs Splunk Inc.
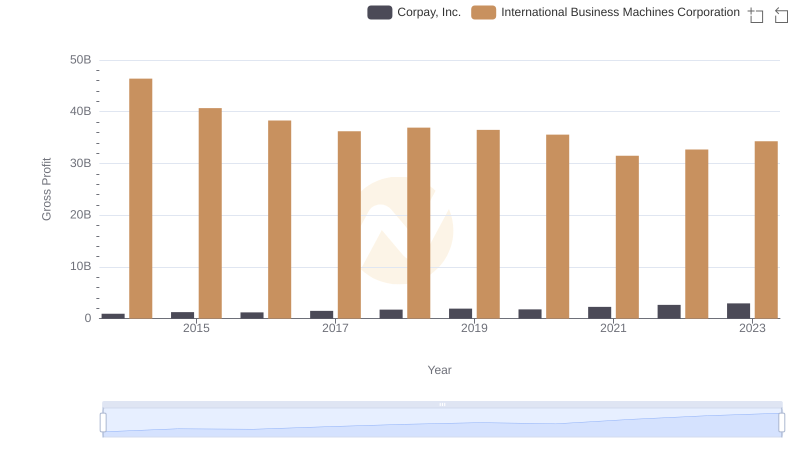
Who Generates Higher Gross Profit? International Business Machines Corporation or Corpay, Inc.
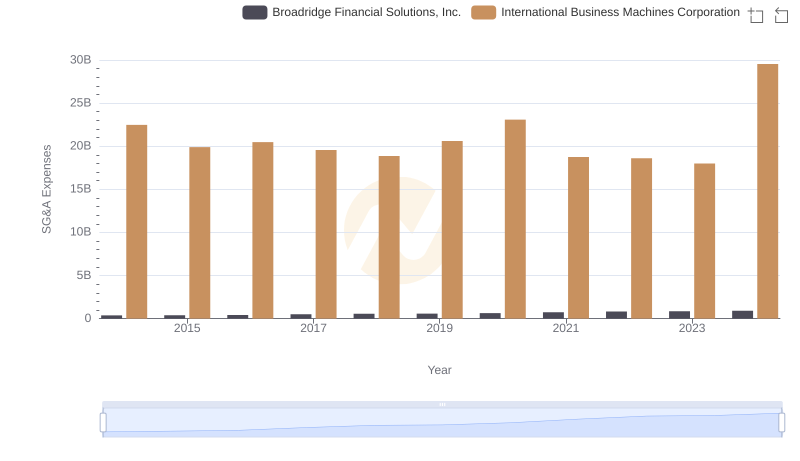
Operational Costs Compared: SG&A Analysis of International Business Machines Corporation and Broadridge Financial Solutions, Inc.
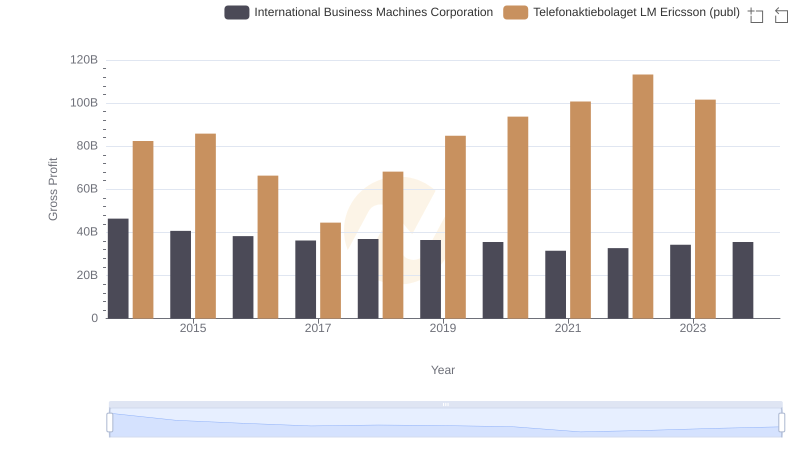
Key Insights on Gross Profit: International Business Machines Corporation vs Telefonaktiebolaget LM Ericsson (publ)
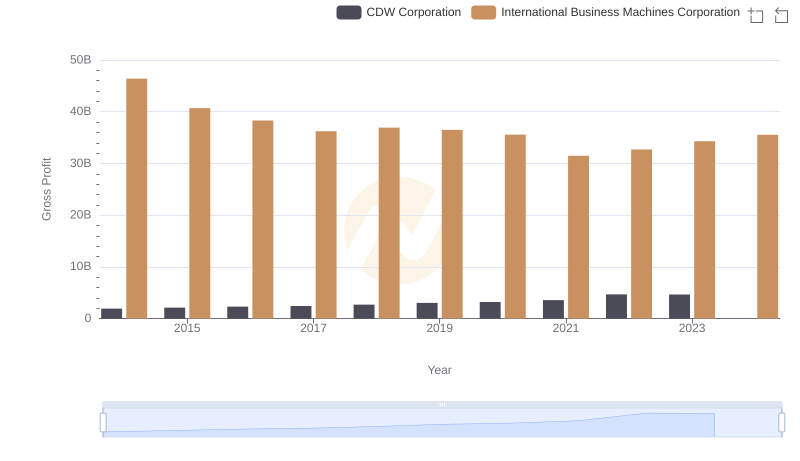
Gross Profit Comparison: International Business Machines Corporation and CDW Corporation Trends
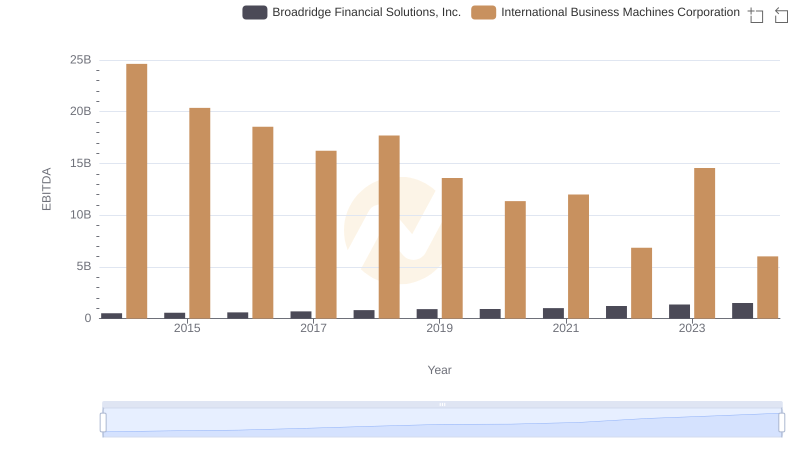
International Business Machines Corporation and Broadridge Financial Solutions, Inc.: A Detailed Examination of EBITDA Performance