| __timestamp | Broadridge Financial Solutions, Inc. | International Business Machines Corporation |
|---|---|---|
| Wednesday, January 1, 2014 | 2558000000 | 92793000000 |
| Thursday, January 1, 2015 | 2694200000 | 81742000000 |
| Friday, January 1, 2016 | 2897000000 | 79920000000 |
| Sunday, January 1, 2017 | 4142600000 | 79139000000 |
| Monday, January 1, 2018 | 4329900000 | 79591000000 |
| Tuesday, January 1, 2019 | 4362200000 | 57714000000 |
| Wednesday, January 1, 2020 | 4529000000 | 55179000000 |
| Friday, January 1, 2021 | 4993700000 | 57351000000 |
| Saturday, January 1, 2022 | 5709100000 | 60530000000 |
| Sunday, January 1, 2023 | 6060900000 | 61860000000 |
| Monday, January 1, 2024 | 6506800000 | 62753000000 |
Cracking the code
In the ever-evolving landscape of technology and financial services, International Business Machines Corporation (IBM) and Broadridge Financial Solutions, Inc. have showcased distinct revenue trajectories from 2014 to 2024. IBM, a stalwart in the tech industry, experienced a revenue decline of approximately 32% over this period, reflecting the challenges faced by traditional tech giants in adapting to new market dynamics. In contrast, Broadridge, a leader in financial technology, saw its revenue soar by over 150%, underscoring the growing demand for innovative financial solutions.
By 2024, Broadridge's revenue reached nearly 6.5 billion, marking a consistent upward trend. Meanwhile, IBM's revenue stabilized around 62.8 billion, highlighting its strategic pivots. This comparison not only illustrates the shifting tides in their respective industries but also emphasizes the importance of adaptability and innovation in sustaining growth.
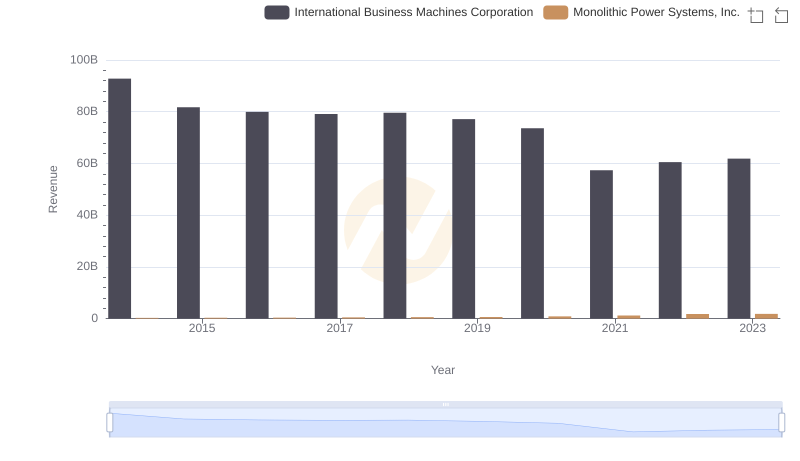
International Business Machines Corporation vs Monolithic Power Systems, Inc.: Examining Key Revenue Metrics
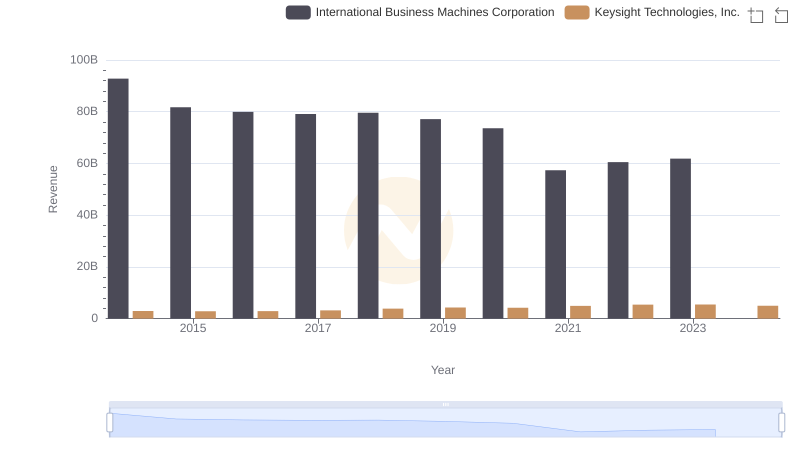
International Business Machines Corporation or Keysight Technologies, Inc.: Who Leads in Yearly Revenue?
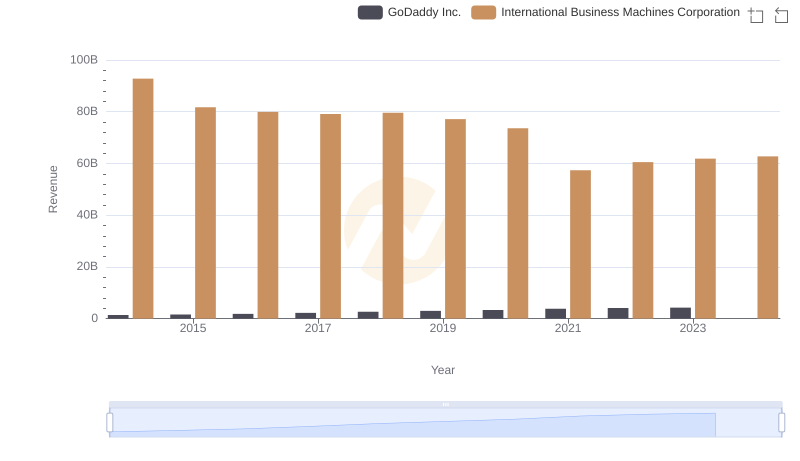
Who Generates More Revenue? International Business Machines Corporation or GoDaddy Inc.
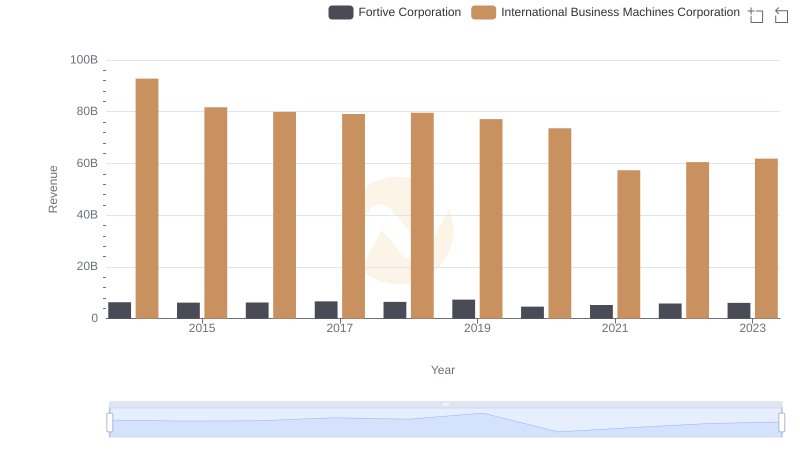
Annual Revenue Comparison: International Business Machines Corporation vs Fortive Corporation
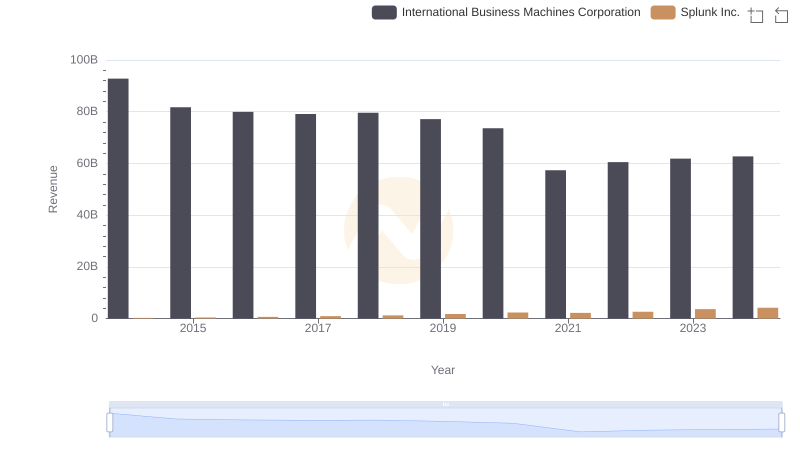
Comparing Revenue Performance: International Business Machines Corporation or Splunk Inc.?
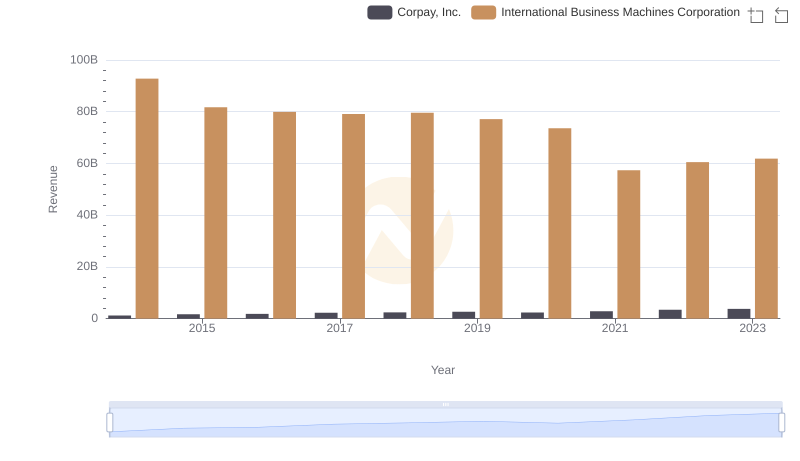
Comparing Revenue Performance: International Business Machines Corporation or Corpay, Inc.?
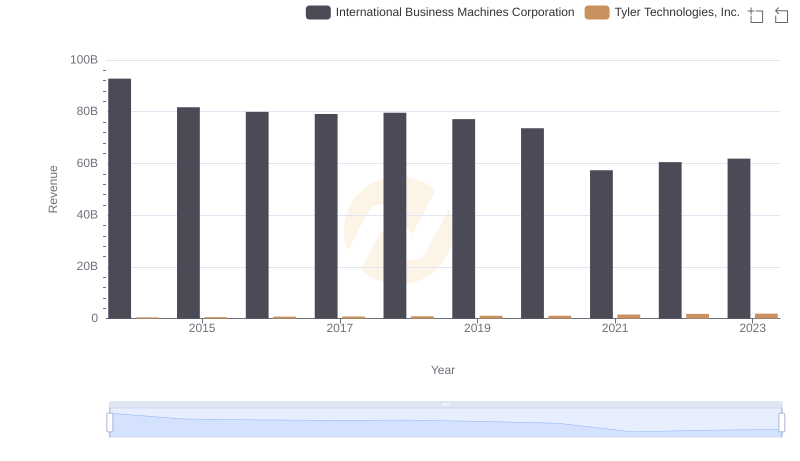
International Business Machines Corporation vs Tyler Technologies, Inc.: Examining Key Revenue Metrics
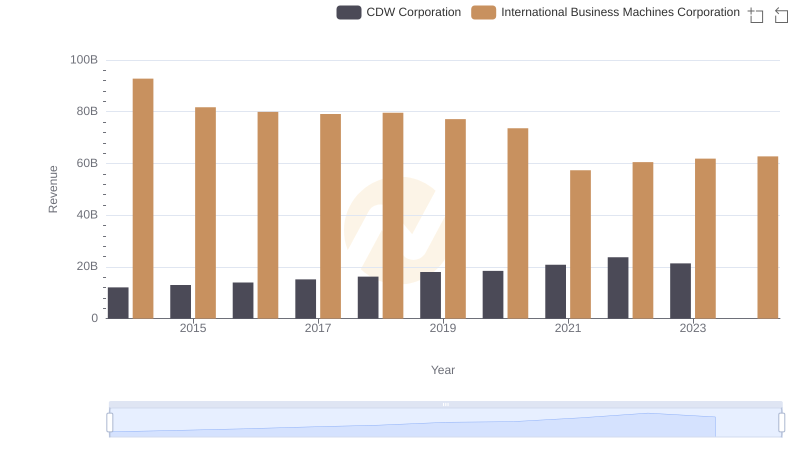
Who Generates More Revenue? International Business Machines Corporation or CDW Corporation

Analyzing Cost of Revenue: International Business Machines Corporation and Broadridge Financial Solutions, Inc.
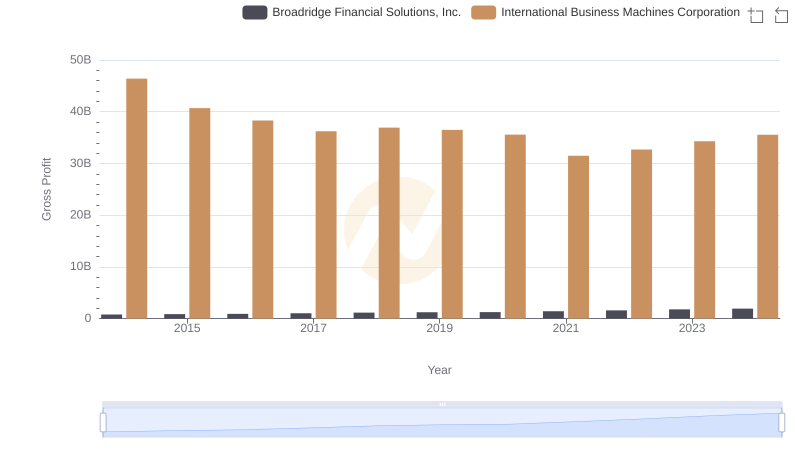
Gross Profit Trends Compared: International Business Machines Corporation vs Broadridge Financial Solutions, Inc.
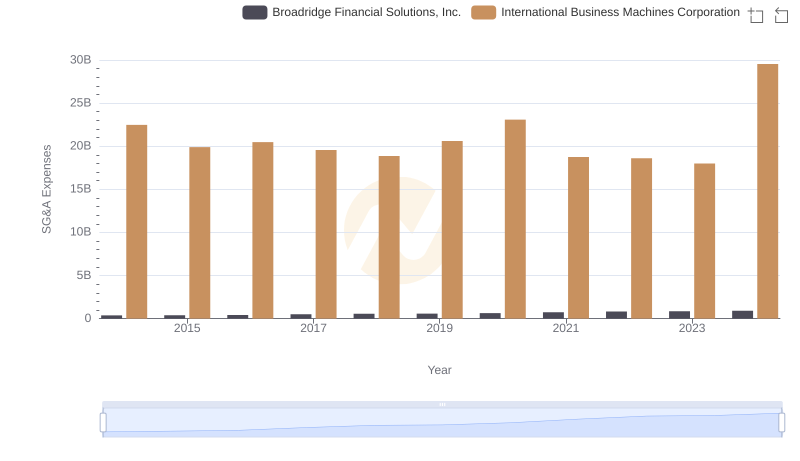
Operational Costs Compared: SG&A Analysis of International Business Machines Corporation and Broadridge Financial Solutions, Inc.
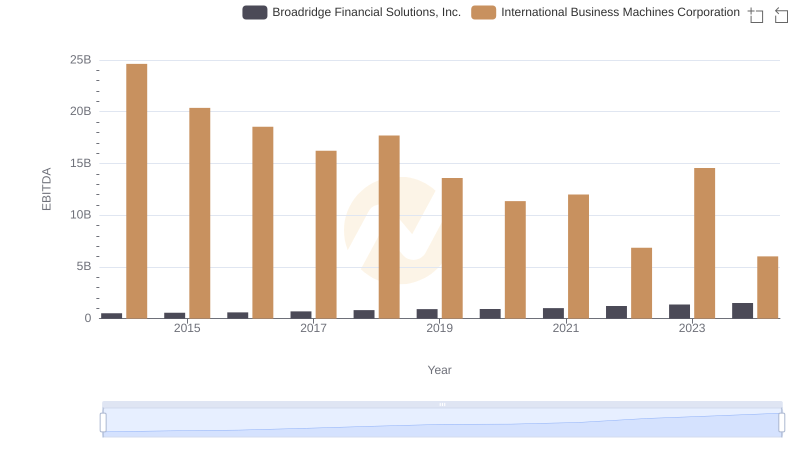
International Business Machines Corporation and Broadridge Financial Solutions, Inc.: A Detailed Examination of EBITDA Performance