| __timestamp | Hewlett Packard Enterprise Company | International Business Machines Corporation |
|---|---|---|
| Wednesday, January 1, 2014 | 7961000000 | 24962000000 |
| Thursday, January 1, 2015 | 6964000000 | 20268000000 |
| Friday, January 1, 2016 | 7933000000 | 17341000000 |
| Sunday, January 1, 2017 | 3820000000 | 16556000000 |
| Monday, January 1, 2018 | 3709000000 | 16545000000 |
| Tuesday, January 1, 2019 | 5459000000 | 14609000000 |
| Wednesday, January 1, 2020 | 4263000000 | 10555000000 |
| Friday, January 1, 2021 | 4853000000 | 12409000000 |
| Saturday, January 1, 2022 | 4779000000 | 7174000000 |
| Sunday, January 1, 2023 | 5058000000 | 14693000000 |
| Monday, January 1, 2024 | 5024000000 | 6015000000 |
Unlocking the unknown
In the ever-evolving landscape of technology giants, the financial performance of International Business Machines Corporation (IBM) and Hewlett Packard Enterprise Company (HPE) offers a fascinating glimpse into their strategic maneuvers over the past decade. From 2014 to 2024, IBM consistently outperformed HPE in terms of EBITDA, with IBM's peak in 2014 reaching nearly four times that of HPE's highest in the same year. However, both companies experienced a downward trend, with IBM's EBITDA dropping by approximately 75% by 2022, while HPE saw a 53% decline over the same period. Interestingly, 2023 marked a resurgence for IBM, with a 113% increase from the previous year, while HPE's growth was more modest at 6%. This data underscores the dynamic nature of the tech industry, where strategic pivots and market conditions can significantly impact financial outcomes.
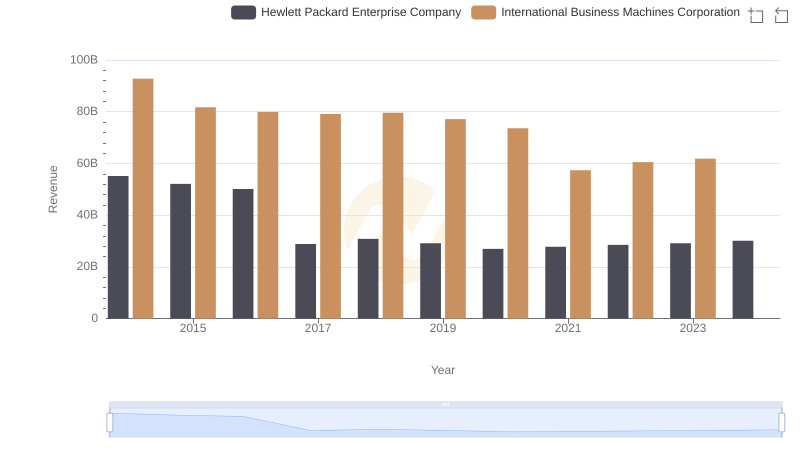
Who Generates More Revenue? International Business Machines Corporation or Hewlett Packard Enterprise Company
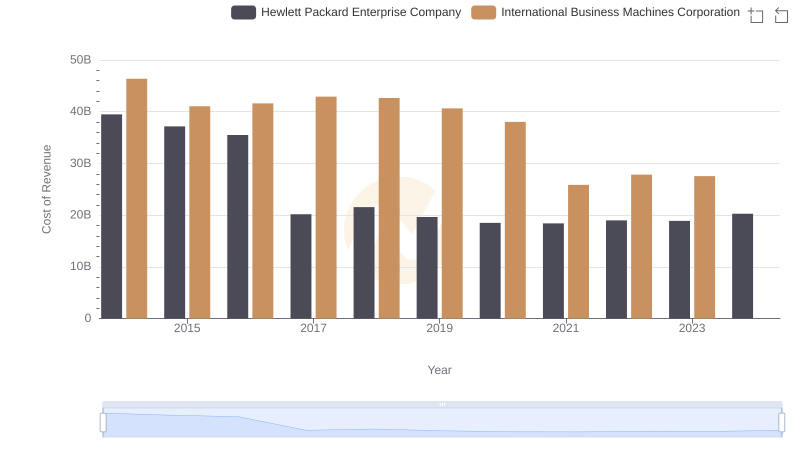
Analyzing Cost of Revenue: International Business Machines Corporation and Hewlett Packard Enterprise Company
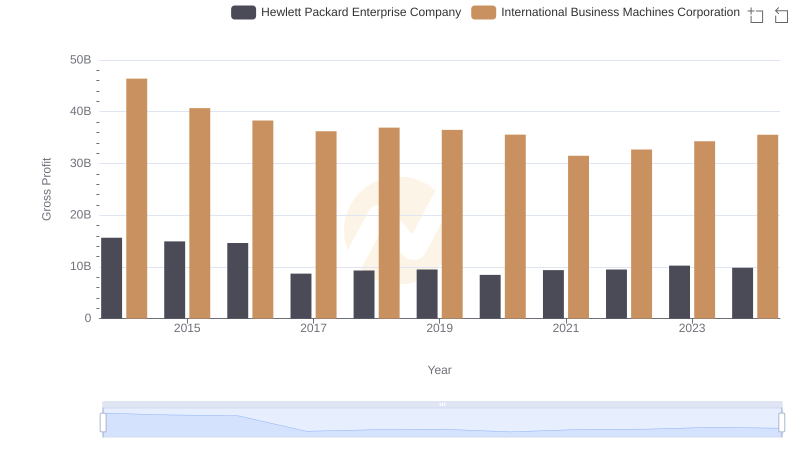
Gross Profit Analysis: Comparing International Business Machines Corporation and Hewlett Packard Enterprise Company
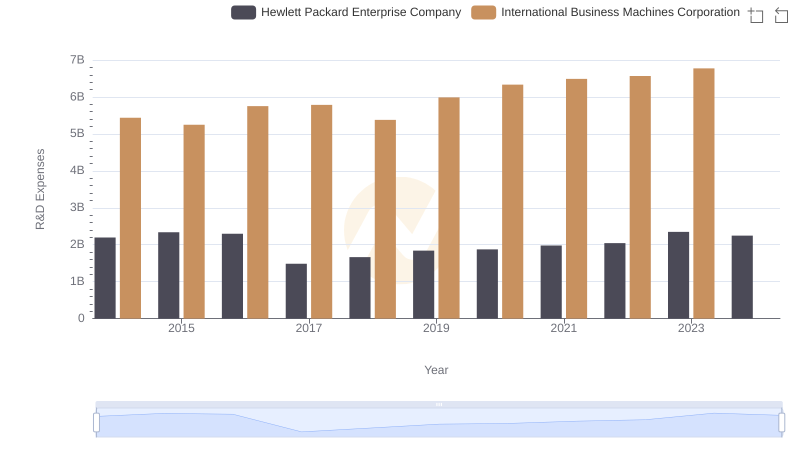
Research and Development Investment: International Business Machines Corporation vs Hewlett Packard Enterprise Company
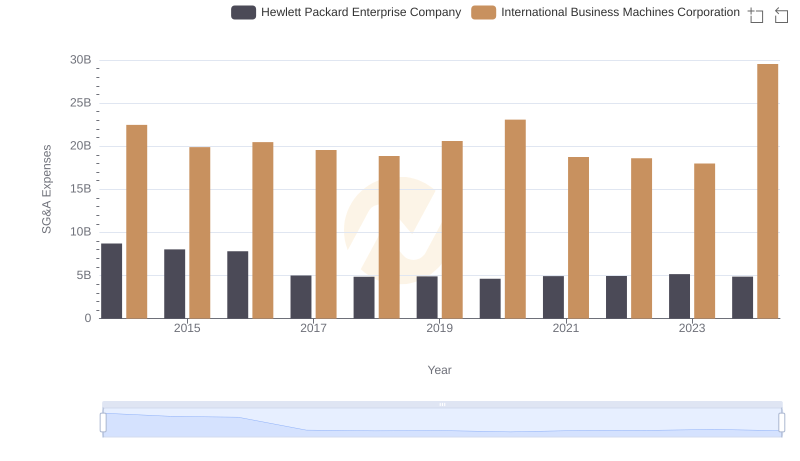
Comparing SG&A Expenses: International Business Machines Corporation vs Hewlett Packard Enterprise Company Trends and Insights
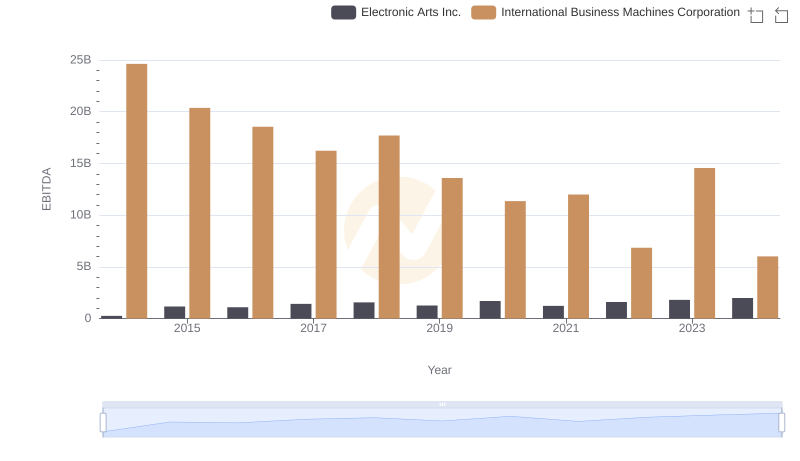
EBITDA Performance Review: International Business Machines Corporation vs Electronic Arts Inc.
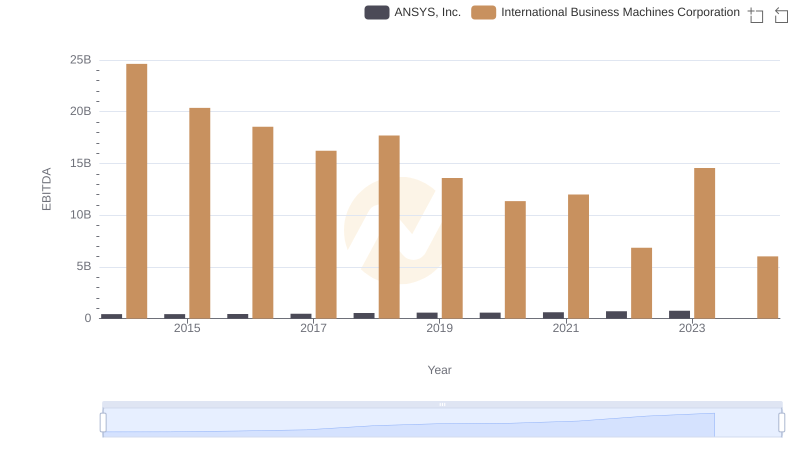
Comparative EBITDA Analysis: International Business Machines Corporation vs ANSYS, Inc.
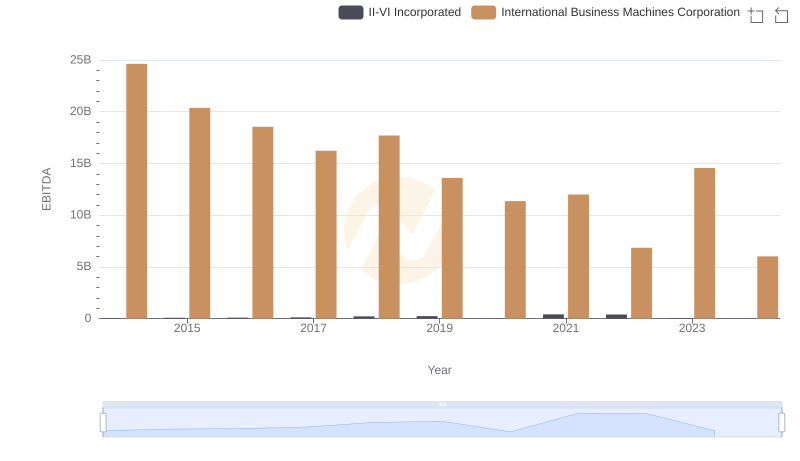
A Professional Review of EBITDA: International Business Machines Corporation Compared to II-VI Incorporated
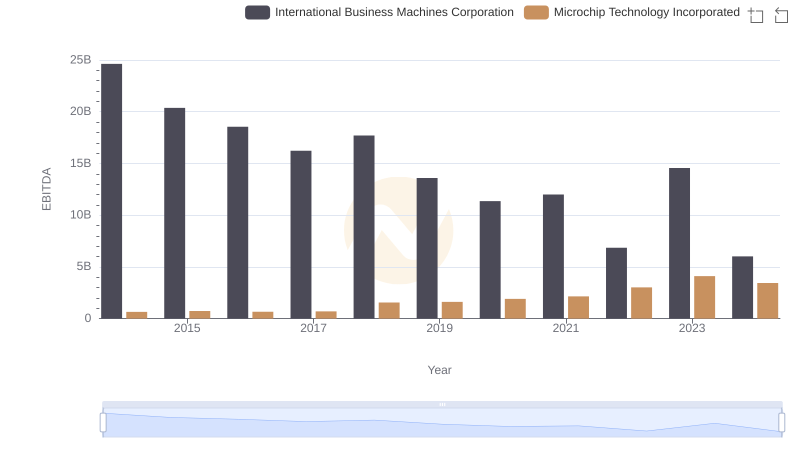
EBITDA Metrics Evaluated: International Business Machines Corporation vs Microchip Technology Incorporated
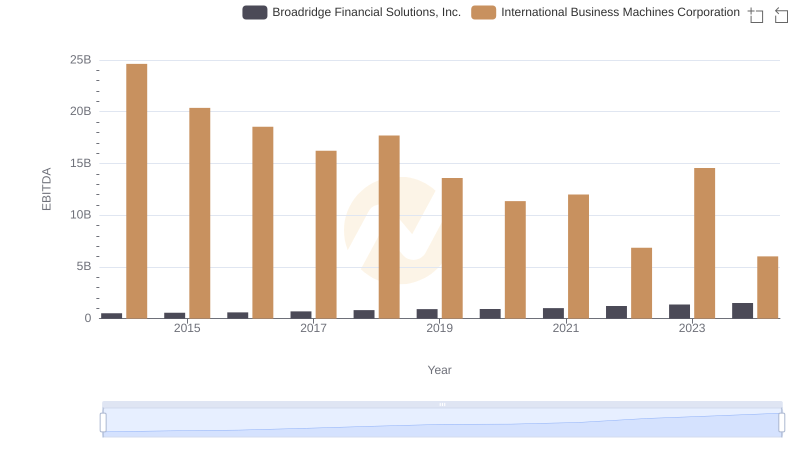
International Business Machines Corporation and Broadridge Financial Solutions, Inc.: A Detailed Examination of EBITDA Performance
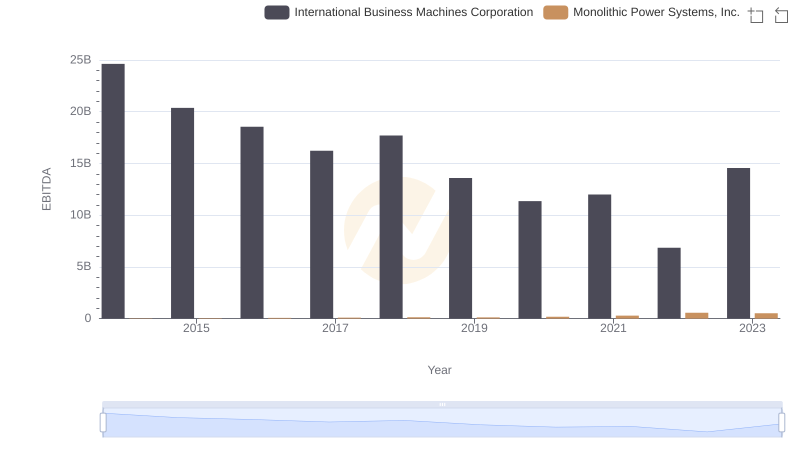
EBITDA Performance Review: International Business Machines Corporation vs Monolithic Power Systems, Inc.
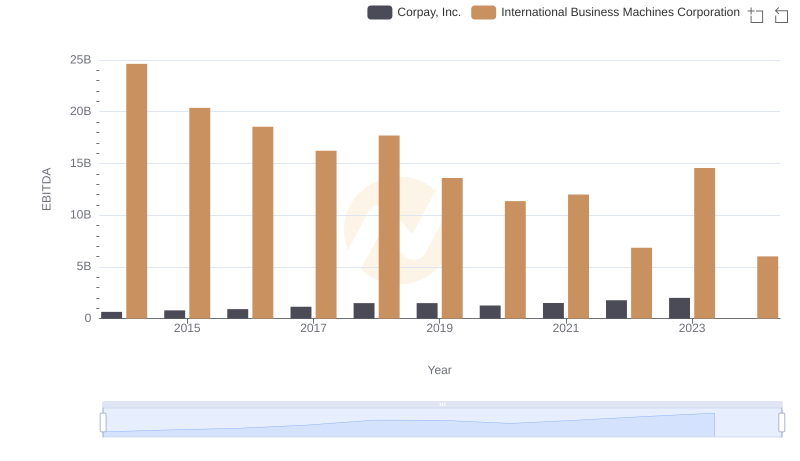
Professional EBITDA Benchmarking: International Business Machines Corporation vs Corpay, Inc.