| __timestamp | EMCOR Group, Inc. | Lennox International Inc. |
|---|---|---|
| Wednesday, January 1, 2014 | 5517719000 | 2464100000 |
| Thursday, January 1, 2015 | 5774247000 | 2520000000 |
| Friday, January 1, 2016 | 6513662000 | 2565100000 |
| Sunday, January 1, 2017 | 6539987000 | 2714400000 |
| Monday, January 1, 2018 | 6925178000 | 2772700000 |
| Tuesday, January 1, 2019 | 7818743000 | 2727400000 |
| Wednesday, January 1, 2020 | 7401679000 | 2594000000 |
| Friday, January 1, 2021 | 8401843000 | 3005700000 |
| Saturday, January 1, 2022 | 9472526000 | 3433700000 |
| Sunday, January 1, 2023 | 10493534000 | 3434100000 |
| Monday, January 1, 2024 | 3569400000 |
Unleashing the power of data
In the competitive landscape of industrial services, Lennox International Inc. and EMCOR Group, Inc. have showcased distinct trajectories in cost of revenue efficiency over the past decade. From 2014 to 2023, EMCOR Group, Inc. has consistently outpaced Lennox International Inc., with a remarkable 90% increase in cost of revenue, peaking at approximately $10.5 billion in 2023. In contrast, Lennox International Inc. demonstrated a steady growth of around 40%, reaching $3.4 billion in the same year.
This divergence highlights EMCOR's aggressive expansion and operational scale, while Lennox maintains a more conservative growth strategy. The data from 2024 is incomplete, suggesting a need for further analysis to understand future trends. As these industry leaders continue to evolve, their strategies in managing cost of revenue will be pivotal in shaping their competitive edge.
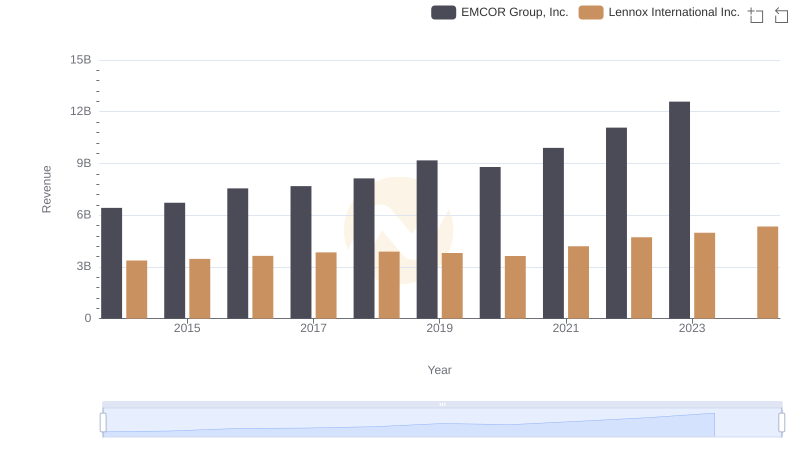
Who Generates More Revenue? Lennox International Inc. or EMCOR Group, Inc.
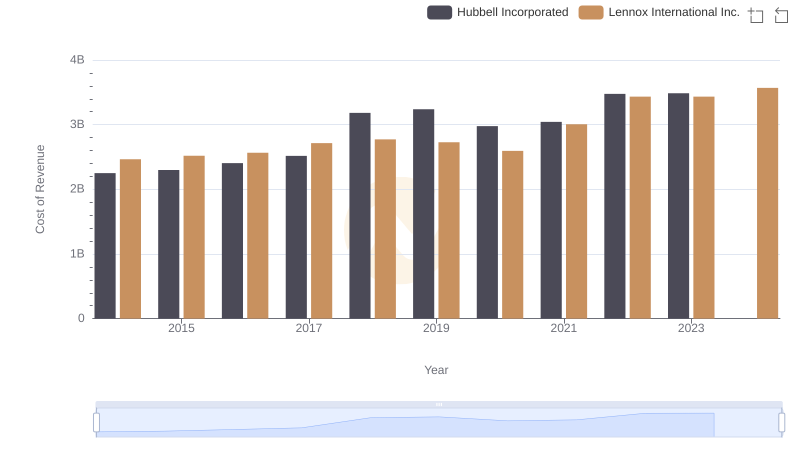
Cost of Revenue Comparison: Lennox International Inc. vs Hubbell Incorporated
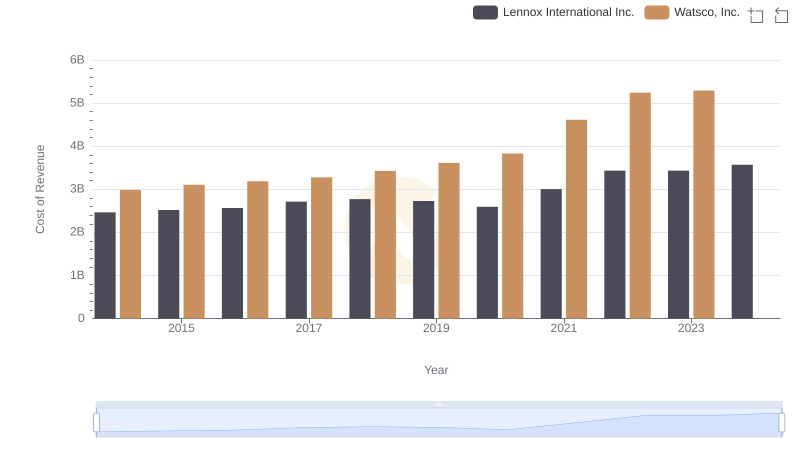
Cost of Revenue Trends: Lennox International Inc. vs Watsco, Inc.
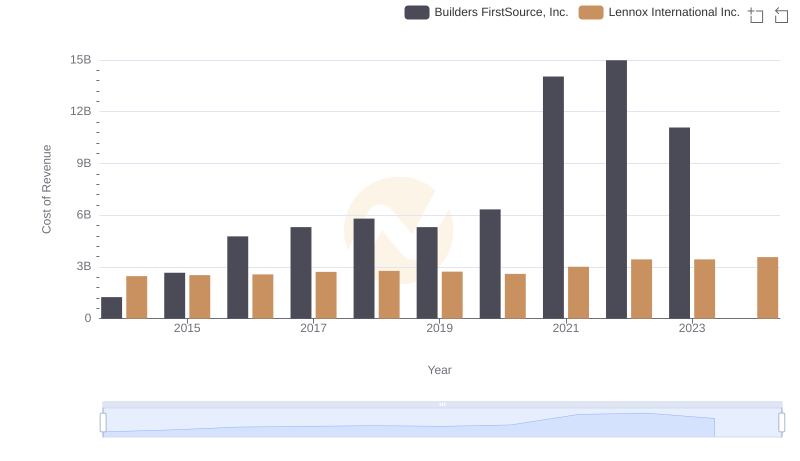
Cost Insights: Breaking Down Lennox International Inc. and Builders FirstSource, Inc.'s Expenses
Analyzing Cost of Revenue: Lennox International Inc. and AerCap Holdings N.V.
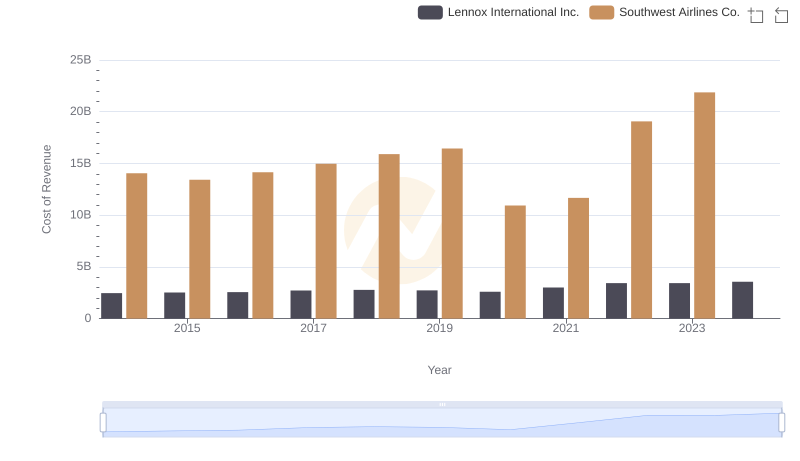
Comparing Cost of Revenue Efficiency: Lennox International Inc. vs Southwest Airlines Co.
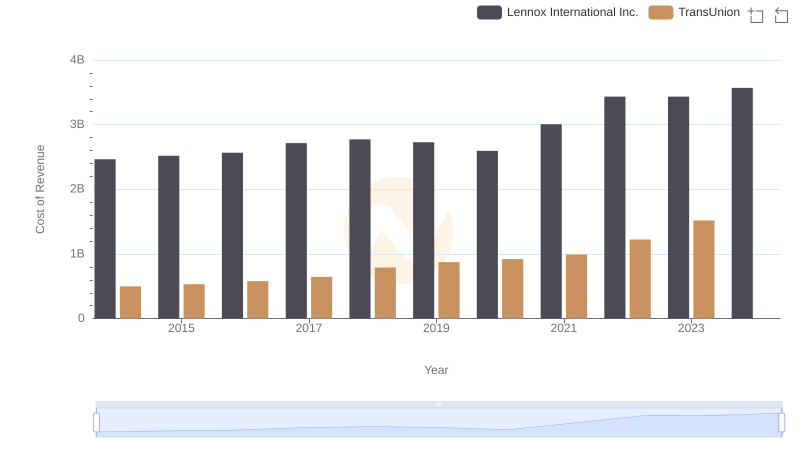
Comparing Cost of Revenue Efficiency: Lennox International Inc. vs TransUnion
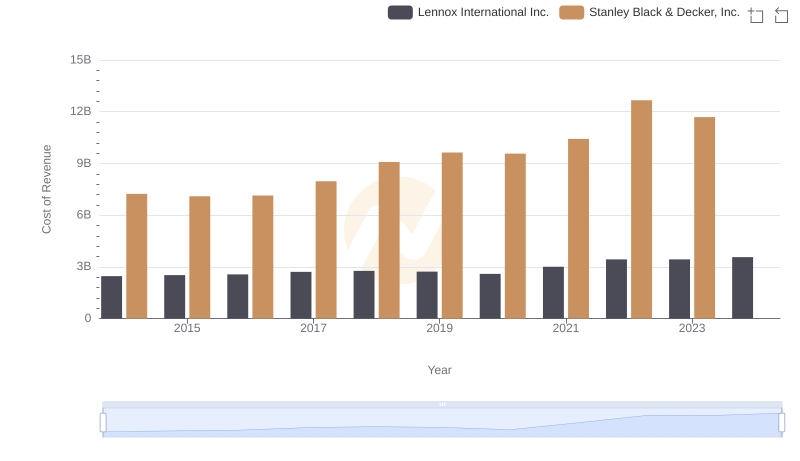
Lennox International Inc. vs Stanley Black & Decker, Inc.: Efficiency in Cost of Revenue Explored
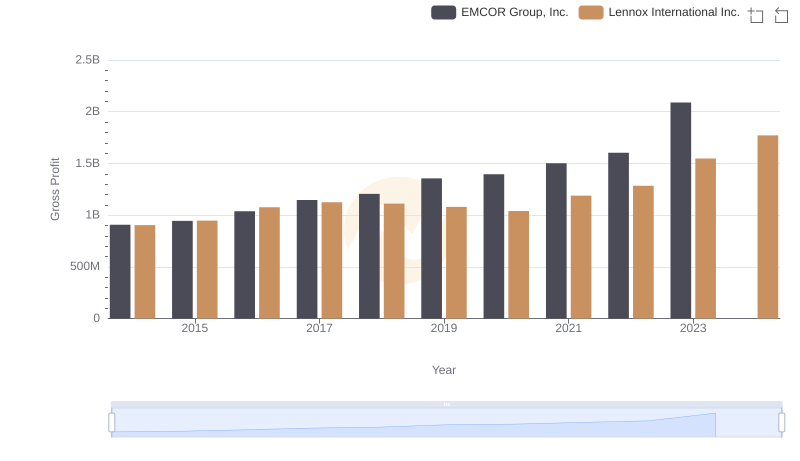
Gross Profit Trends Compared: Lennox International Inc. vs EMCOR Group, Inc.
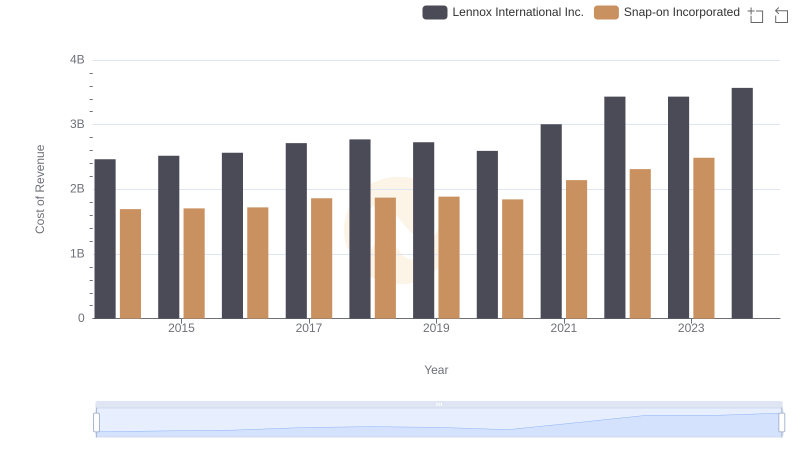
Cost Insights: Breaking Down Lennox International Inc. and Snap-on Incorporated's Expenses
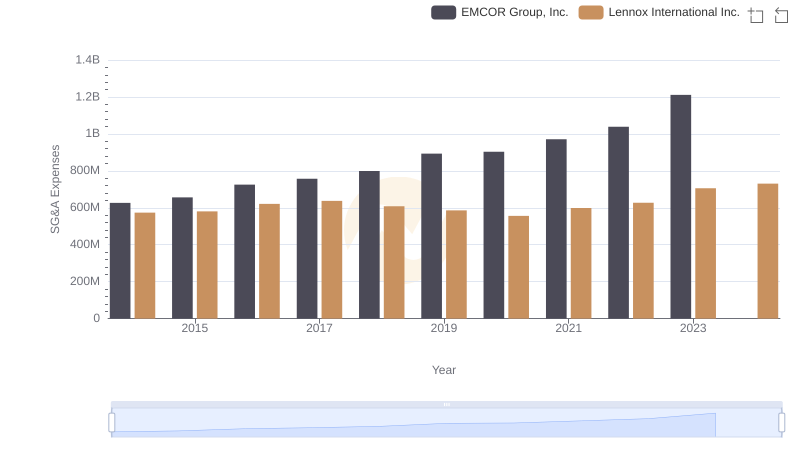
Who Optimizes SG&A Costs Better? Lennox International Inc. or EMCOR Group, Inc.
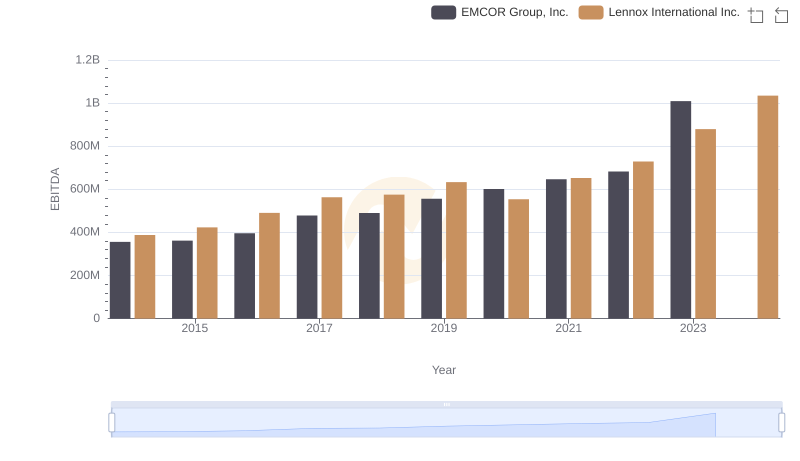
Lennox International Inc. vs EMCOR Group, Inc.: In-Depth EBITDA Performance Comparison