| __timestamp | EMCOR Group, Inc. | Lennox International Inc. |
|---|---|---|
| Wednesday, January 1, 2014 | 6424965000 | 3367400000 |
| Thursday, January 1, 2015 | 6718726000 | 3467400000 |
| Friday, January 1, 2016 | 7551524000 | 3641600000 |
| Sunday, January 1, 2017 | 7686999000 | 3839600000 |
| Monday, January 1, 2018 | 8130631000 | 3883900000 |
| Tuesday, January 1, 2019 | 9174611000 | 3807200000 |
| Wednesday, January 1, 2020 | 8797061000 | 3634100000 |
| Friday, January 1, 2021 | 9903580000 | 4194100000 |
| Saturday, January 1, 2022 | 11076120000 | 4718400000 |
| Sunday, January 1, 2023 | 12582873000 | 4981900000 |
| Monday, January 1, 2024 | 5341300000 |
Unleashing the power of data
In the competitive landscape of industrial giants, EMCOR Group, Inc. and Lennox International Inc. have been vying for revenue supremacy over the past decade. From 2014 to 2023, EMCOR consistently outpaced Lennox, with its revenue growing by approximately 96%, reaching a peak of $12.6 billion in 2023. In contrast, Lennox's revenue increased by about 48% during the same period, culminating in $5 billion in 2023.
EMCOR's revenue trajectory showcases a robust growth pattern, particularly between 2021 and 2023, where it surged by nearly 27%. Meanwhile, Lennox demonstrated steady growth, with a notable 13% increase from 2021 to 2023. Despite missing data for 2024, Lennox's projected revenue suggests continued upward momentum. This analysis highlights EMCOR's dominant market position, while Lennox remains a formidable contender in the industrial sector.
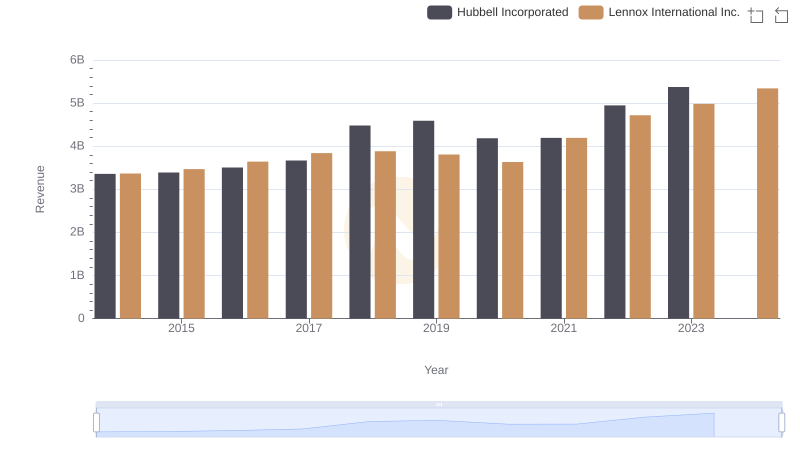
Revenue Showdown: Lennox International Inc. vs Hubbell Incorporated
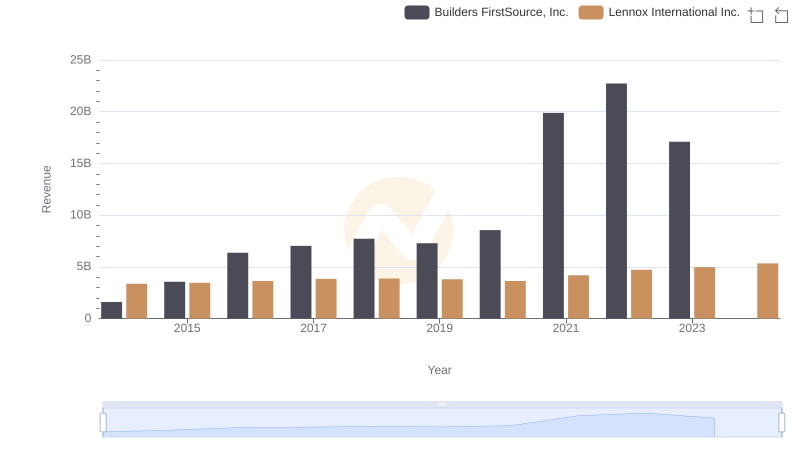
Lennox International Inc. and Builders FirstSource, Inc.: A Comprehensive Revenue Analysis
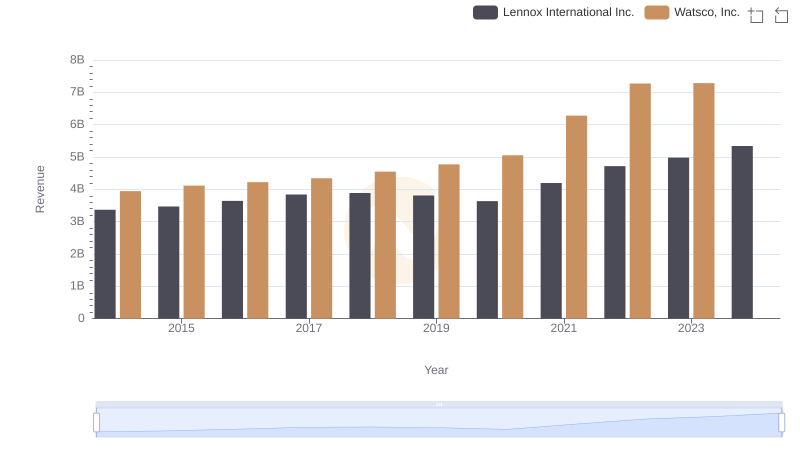
Comparing Revenue Performance: Lennox International Inc. or Watsco, Inc.?
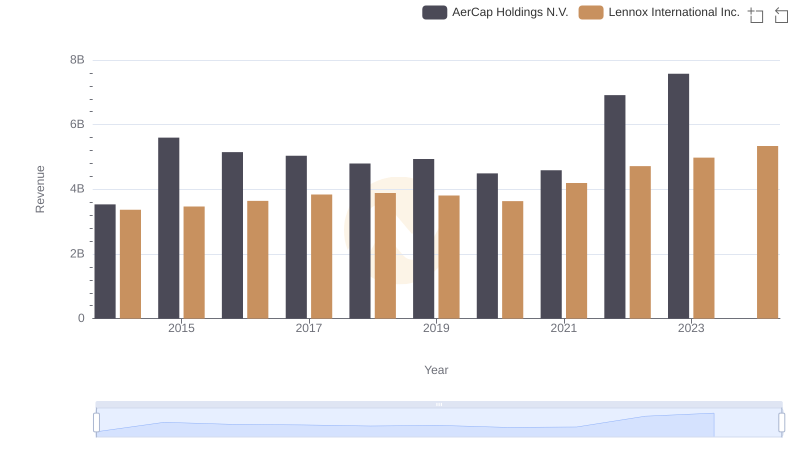
Annual Revenue Comparison: Lennox International Inc. vs AerCap Holdings N.V.
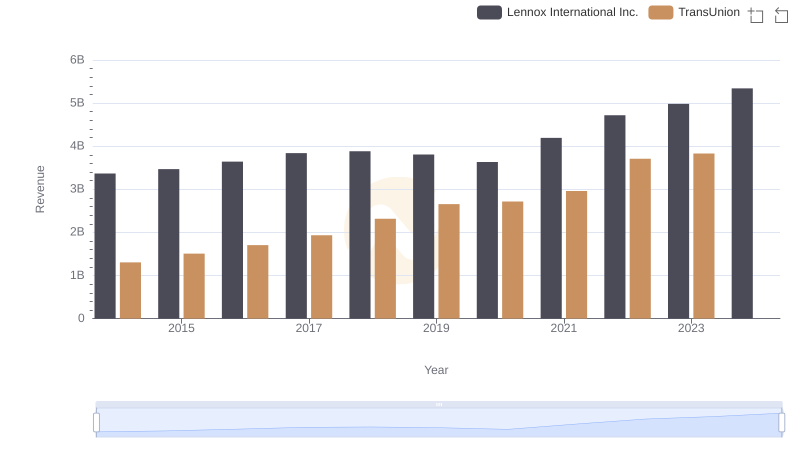
Lennox International Inc. vs TransUnion: Examining Key Revenue Metrics
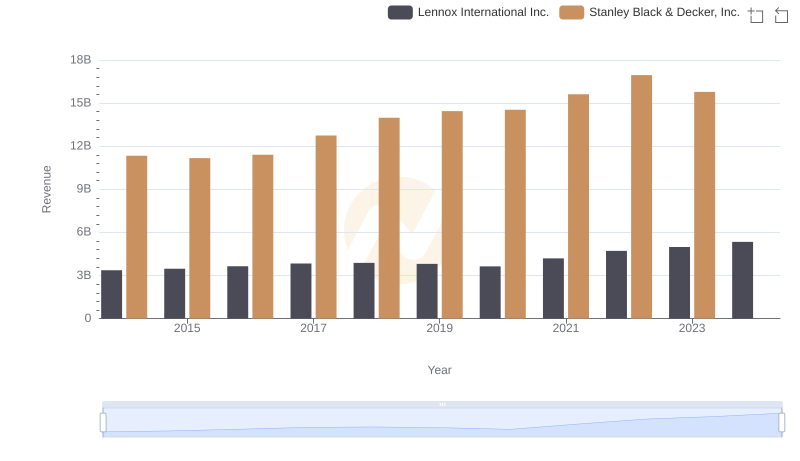
Lennox International Inc. vs Stanley Black & Decker, Inc.: Annual Revenue Growth Compared
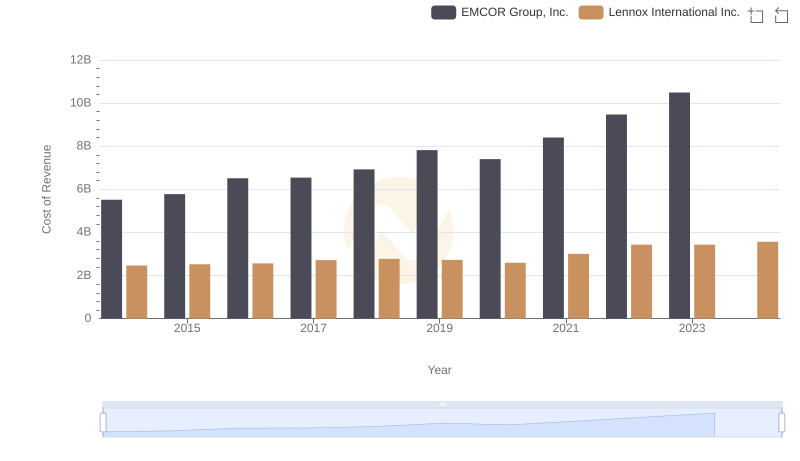
Comparing Cost of Revenue Efficiency: Lennox International Inc. vs EMCOR Group, Inc.
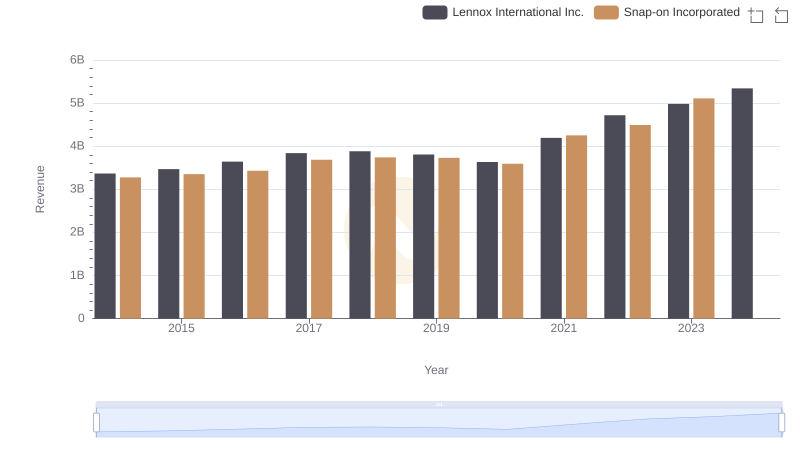
Lennox International Inc. vs Snap-on Incorporated: Examining Key Revenue Metrics
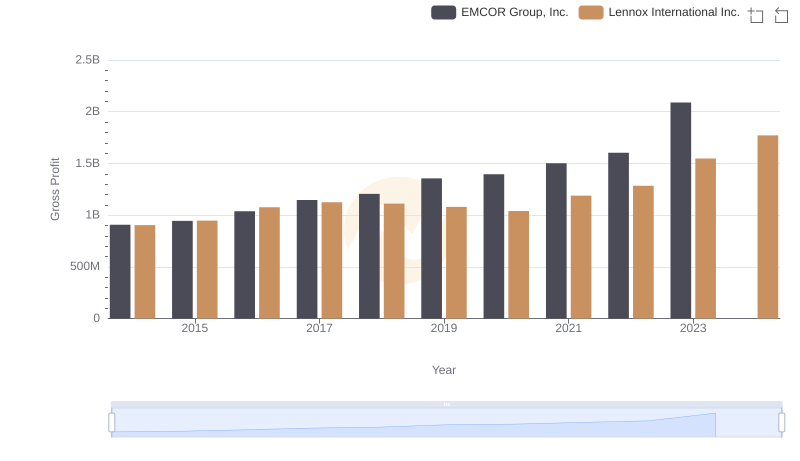
Gross Profit Trends Compared: Lennox International Inc. vs EMCOR Group, Inc.
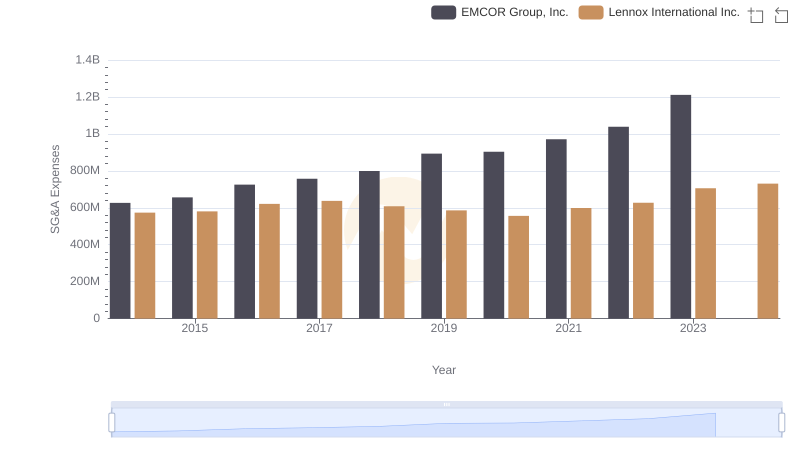
Who Optimizes SG&A Costs Better? Lennox International Inc. or EMCOR Group, Inc.
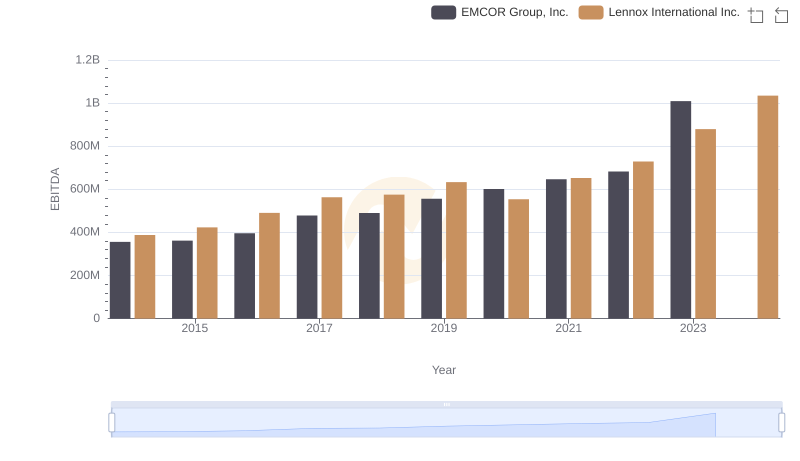
Lennox International Inc. vs EMCOR Group, Inc.: In-Depth EBITDA Performance Comparison