| __timestamp | Builders FirstSource, Inc. | Lennox International Inc. |
|---|---|---|
| Wednesday, January 1, 2014 | 60008000 | 387700000 |
| Thursday, January 1, 2015 | 148897000 | 423600000 |
| Friday, January 1, 2016 | 346129000 | 490800000 |
| Sunday, January 1, 2017 | 378096000 | 562900000 |
| Monday, January 1, 2018 | 466874000 | 575200000 |
| Tuesday, January 1, 2019 | 492344000 | 633300000 |
| Wednesday, January 1, 2020 | 660420000 | 553900000 |
| Friday, January 1, 2021 | 2934776000 | 652500000 |
| Saturday, January 1, 2022 | 4267346000 | 729000000 |
| Sunday, January 1, 2023 | 2734594000 | 879500000 |
| Monday, January 1, 2024 | 1034800000 |
Data in motion
In the competitive landscape of the HVAC and building materials industries, Lennox International Inc. and Builders FirstSource, Inc. have shown remarkable financial trajectories over the past decade. From 2014 to 2023, Builders FirstSource, Inc. experienced a staggering growth in EBITDA, surging from a modest $60 million to an impressive $2.73 billion by 2023. This represents an exponential increase of over 4,400%, highlighting the company's strategic expansions and market adaptability.
Conversely, Lennox International Inc. demonstrated steady growth, with EBITDA rising from $387 million in 2014 to $879 million in 2023, marking a robust 127% increase. Despite the absence of data for Builders FirstSource, Inc. in 2024, Lennox International Inc. continued its upward trend, reaching over $1 billion. This analysis underscores the dynamic shifts and resilience within these industries, offering valuable insights for investors and stakeholders.
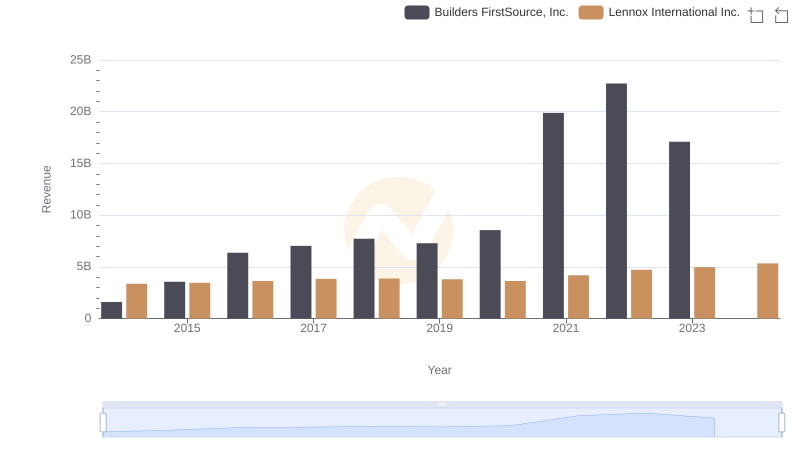
Lennox International Inc. and Builders FirstSource, Inc.: A Comprehensive Revenue Analysis
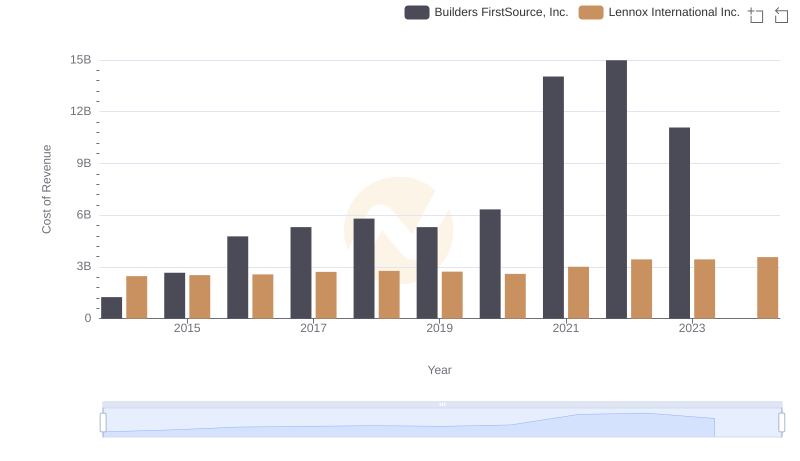
Cost Insights: Breaking Down Lennox International Inc. and Builders FirstSource, Inc.'s Expenses
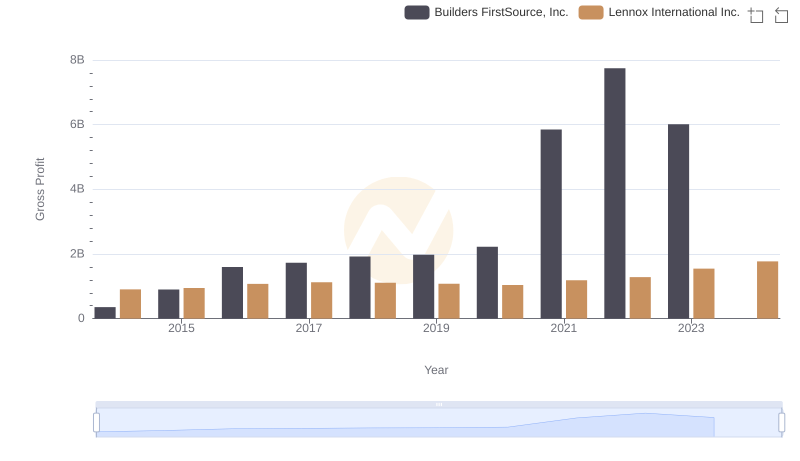
Gross Profit Trends Compared: Lennox International Inc. vs Builders FirstSource, Inc.
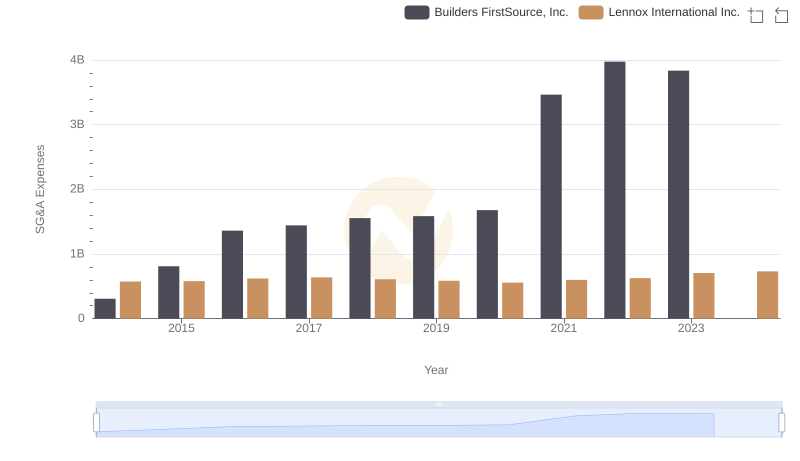
Lennox International Inc. or Builders FirstSource, Inc.: Who Manages SG&A Costs Better?
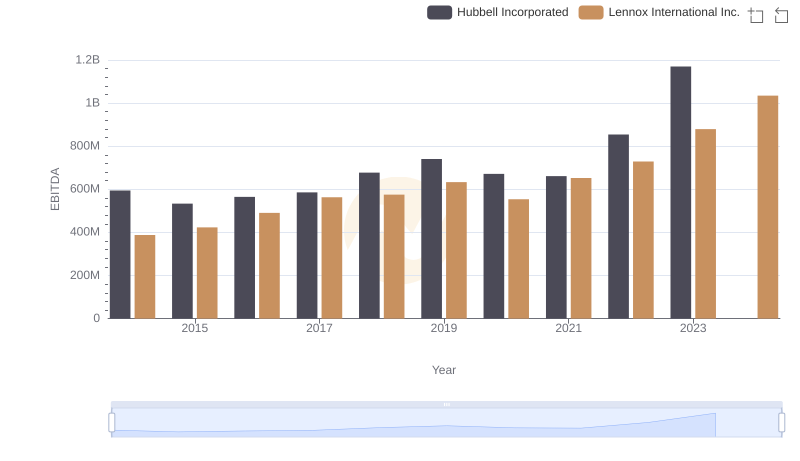
A Side-by-Side Analysis of EBITDA: Lennox International Inc. and Hubbell Incorporated
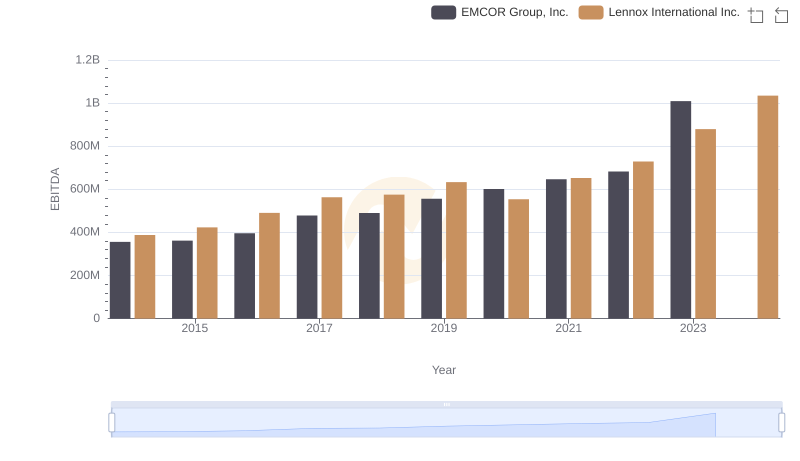
Lennox International Inc. vs EMCOR Group, Inc.: In-Depth EBITDA Performance Comparison
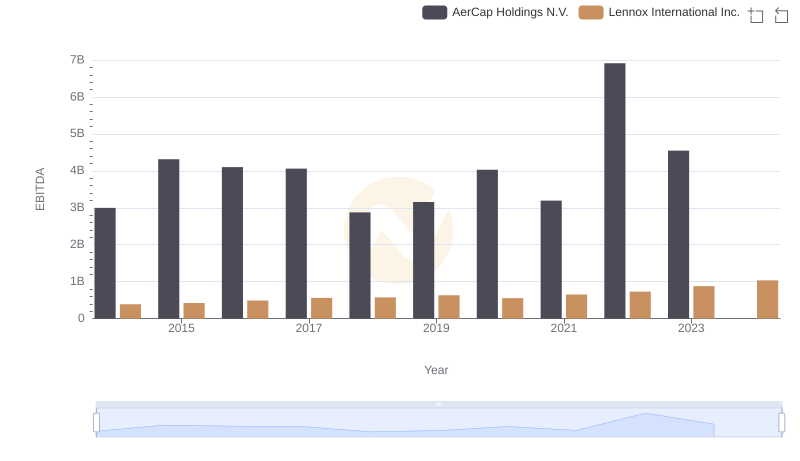
EBITDA Analysis: Evaluating Lennox International Inc. Against AerCap Holdings N.V.
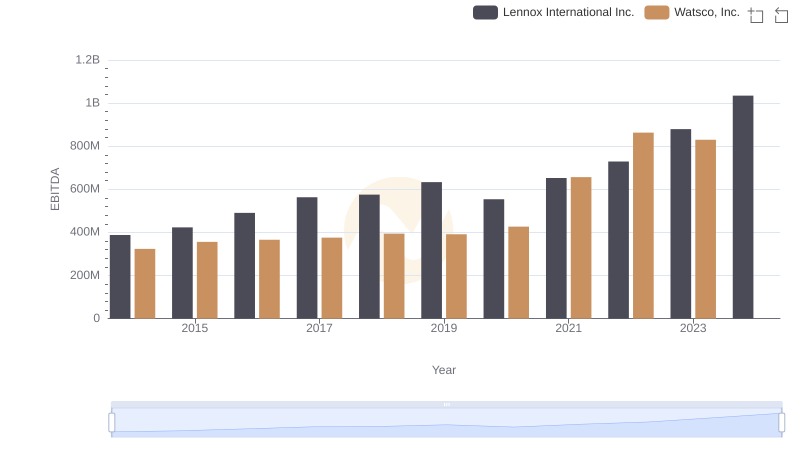
A Professional Review of EBITDA: Lennox International Inc. Compared to Watsco, Inc.
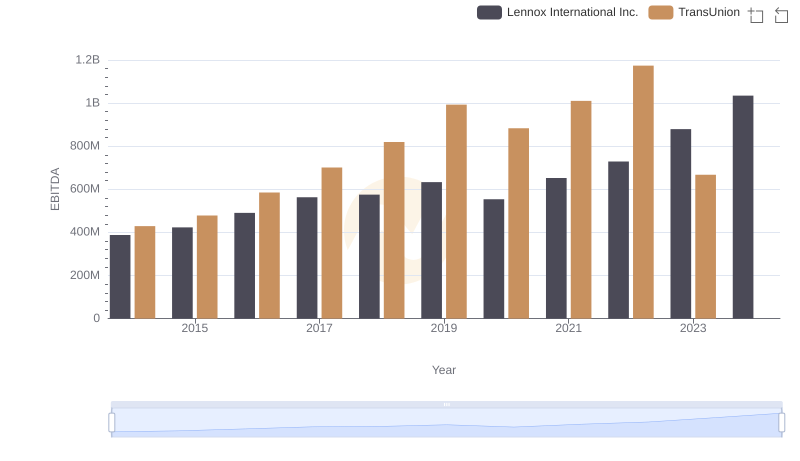
EBITDA Performance Review: Lennox International Inc. vs TransUnion

A Professional Review of EBITDA: Lennox International Inc. Compared to Stanley Black & Decker, Inc.
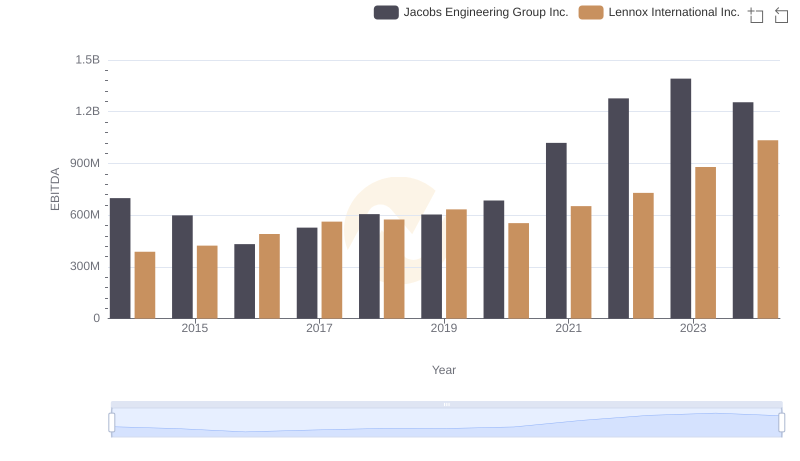
Lennox International Inc. and Jacobs Engineering Group Inc.: A Detailed Examination of EBITDA Performance
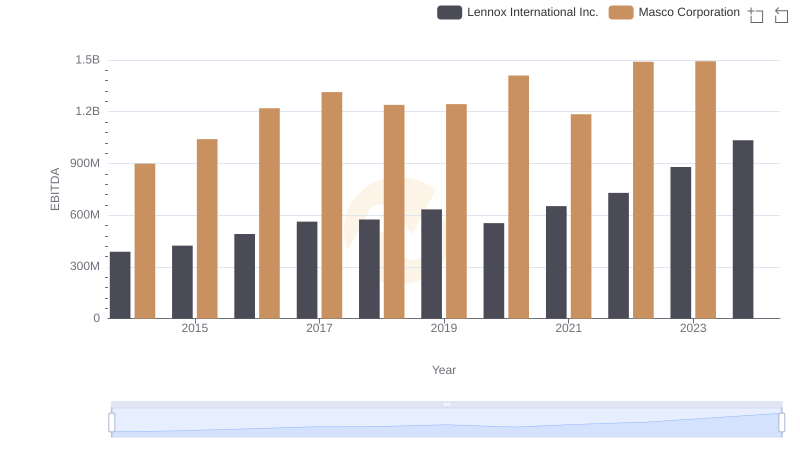
Comprehensive EBITDA Comparison: Lennox International Inc. vs Masco Corporation