| __timestamp | Builders FirstSource, Inc. | Lennox International Inc. |
|---|---|---|
| Wednesday, January 1, 2014 | 306508000 | 573700000 |
| Thursday, January 1, 2015 | 810841000 | 580500000 |
| Friday, January 1, 2016 | 1360412000 | 621000000 |
| Sunday, January 1, 2017 | 1442288000 | 637700000 |
| Monday, January 1, 2018 | 1553972000 | 608200000 |
| Tuesday, January 1, 2019 | 1584523000 | 585900000 |
| Wednesday, January 1, 2020 | 1678730000 | 555900000 |
| Friday, January 1, 2021 | 3463532000 | 598900000 |
| Saturday, January 1, 2022 | 3974173000 | 627200000 |
| Sunday, January 1, 2023 | 3836015000 | 705500000 |
| Monday, January 1, 2024 | 730600000 |
Unlocking the unknown
In the competitive landscape of the building materials industry, managing Selling, General, and Administrative (SG&A) expenses is crucial for profitability. Over the past decade, Builders FirstSource, Inc. and Lennox International Inc. have showcased contrasting strategies in this domain. From 2014 to 2023, Builders FirstSource saw a staggering 1,150% increase in SG&A expenses, peaking in 2022. In contrast, Lennox International maintained a more stable trajectory, with a modest 23% rise over the same period.
This divergence highlights Builders FirstSource's aggressive expansion strategy, reflected in their rising costs, while Lennox's steady approach suggests a focus on efficiency. Notably, Builders FirstSource's expenses surged in 2021, coinciding with industry-wide supply chain challenges. As we look to 2024, Lennox's consistent cost management may offer a competitive edge, while Builders FirstSource's missing data for 2024 leaves room for speculation.
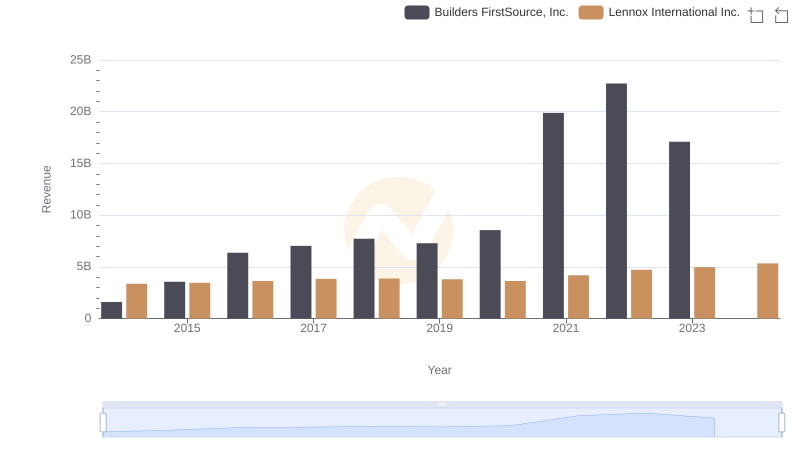
Lennox International Inc. and Builders FirstSource, Inc.: A Comprehensive Revenue Analysis
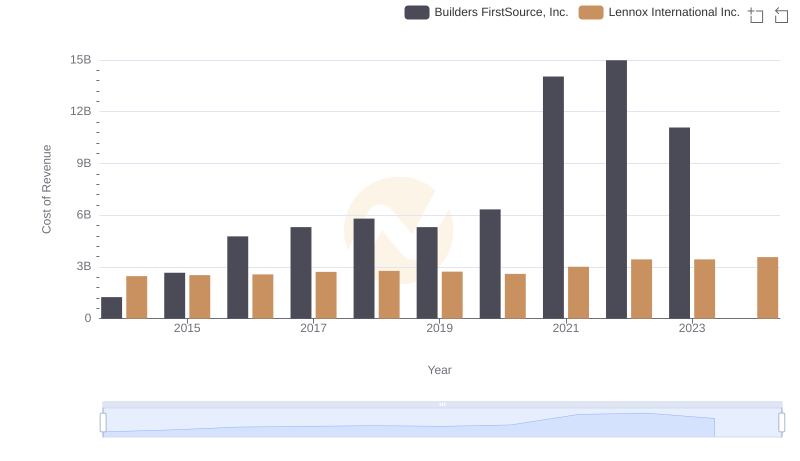
Cost Insights: Breaking Down Lennox International Inc. and Builders FirstSource, Inc.'s Expenses
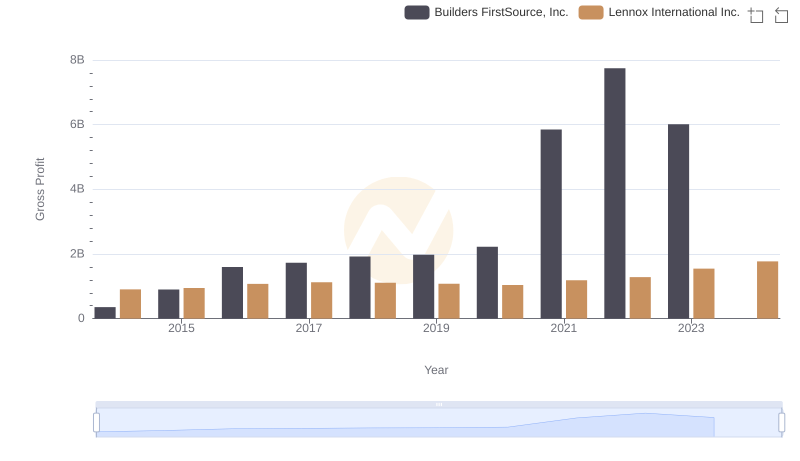
Gross Profit Trends Compared: Lennox International Inc. vs Builders FirstSource, Inc.
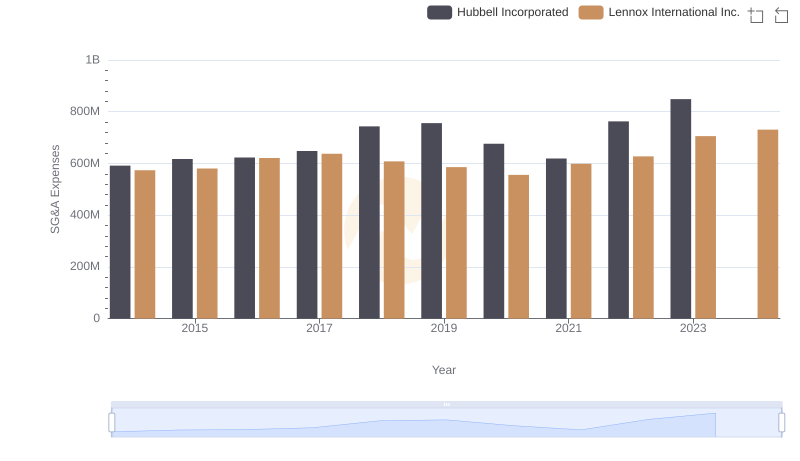
Breaking Down SG&A Expenses: Lennox International Inc. vs Hubbell Incorporated
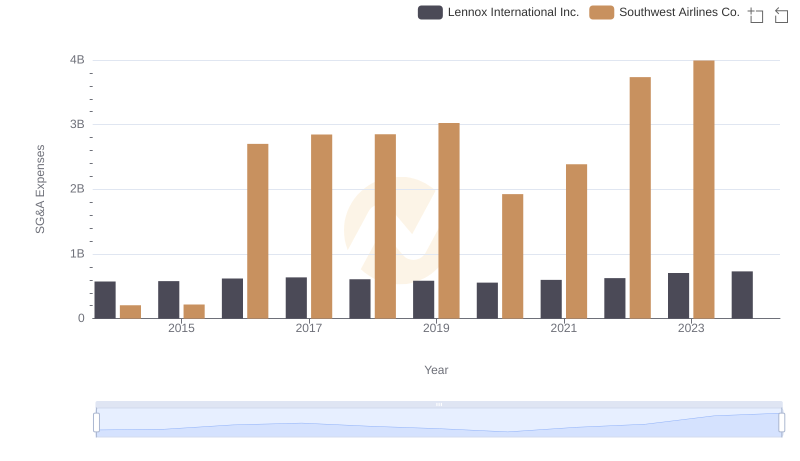
Cost Management Insights: SG&A Expenses for Lennox International Inc. and Southwest Airlines Co.
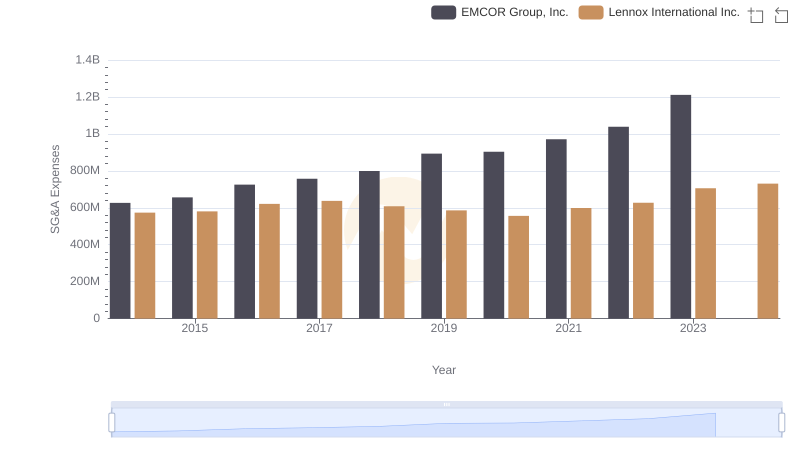
Who Optimizes SG&A Costs Better? Lennox International Inc. or EMCOR Group, Inc.
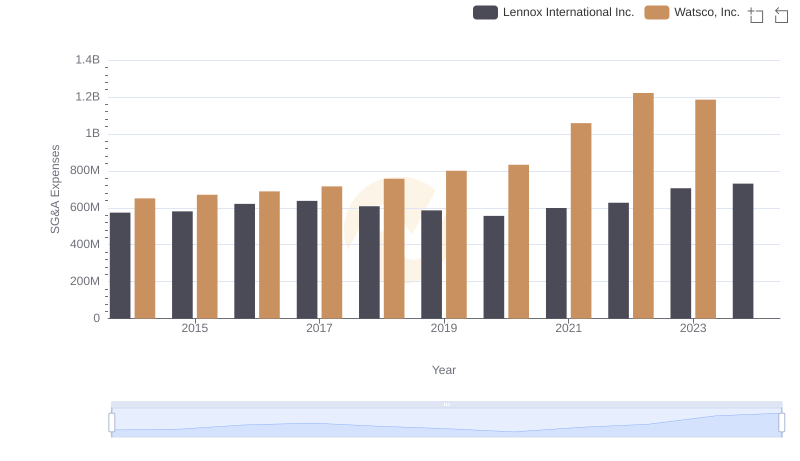
Operational Costs Compared: SG&A Analysis of Lennox International Inc. and Watsco, Inc.
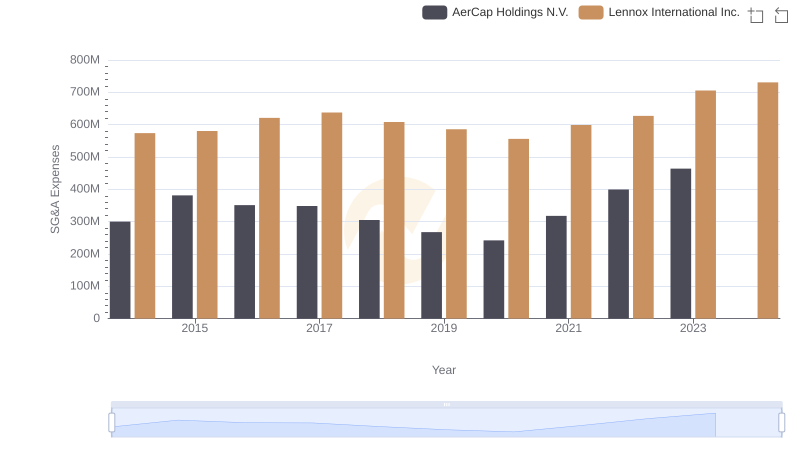
Operational Costs Compared: SG&A Analysis of Lennox International Inc. and AerCap Holdings N.V.
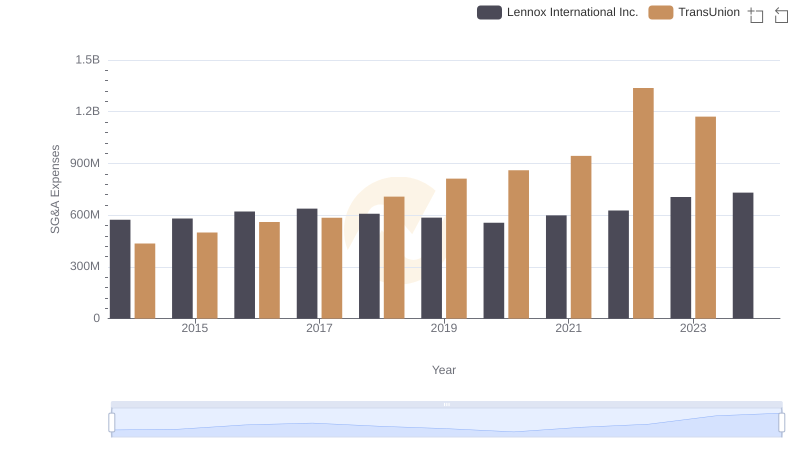
SG&A Efficiency Analysis: Comparing Lennox International Inc. and TransUnion
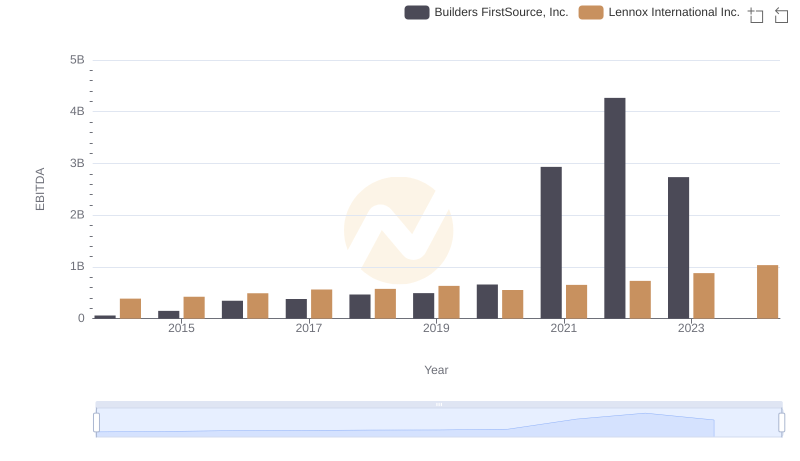
A Professional Review of EBITDA: Lennox International Inc. Compared to Builders FirstSource, Inc.
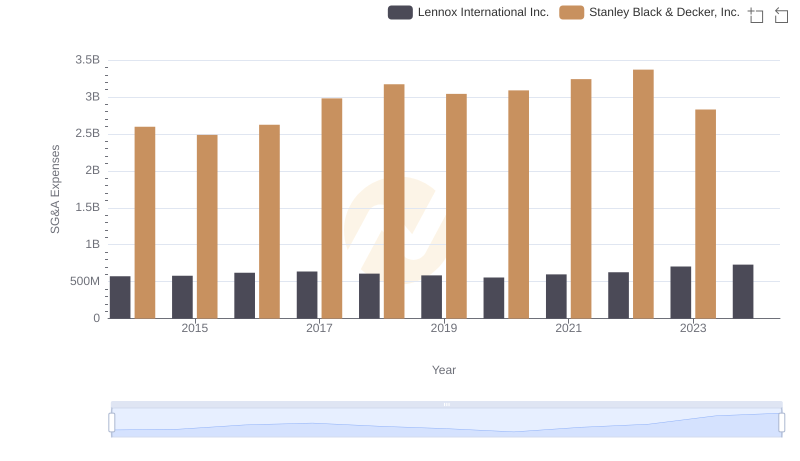
Who Optimizes SG&A Costs Better? Lennox International Inc. or Stanley Black & Decker, Inc.
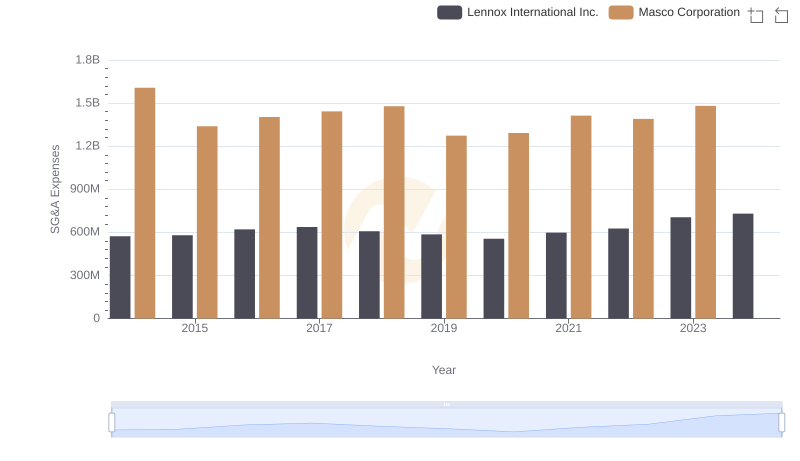
Lennox International Inc. or Masco Corporation: Who Manages SG&A Costs Better?