| __timestamp | Builders FirstSource, Inc. | Lennox International Inc. |
|---|---|---|
| Wednesday, January 1, 2014 | 1247099000 | 2464100000 |
| Thursday, January 1, 2015 | 2662967000 | 2520000000 |
| Friday, January 1, 2016 | 4770536000 | 2565100000 |
| Sunday, January 1, 2017 | 5306818000 | 2714400000 |
| Monday, January 1, 2018 | 5801831000 | 2772700000 |
| Tuesday, January 1, 2019 | 5303602000 | 2727400000 |
| Wednesday, January 1, 2020 | 6336290000 | 2594000000 |
| Friday, January 1, 2021 | 14042900000 | 3005700000 |
| Saturday, January 1, 2022 | 14982039000 | 3433700000 |
| Sunday, January 1, 2023 | 11084996000 | 3434100000 |
| Monday, January 1, 2024 | 3569400000 |
Infusing magic into the data realm
In the ever-evolving landscape of industrial giants, understanding cost structures is pivotal. Lennox International Inc. and Builders FirstSource, Inc. have been at the forefront of their respective sectors, showcasing intriguing cost dynamics over the past decade. From 2014 to 2023, Builders FirstSource, Inc. experienced a staggering 788% increase in its cost of revenue, peaking in 2022. This growth reflects its aggressive expansion and market penetration strategies. In contrast, Lennox International Inc. maintained a more stable trajectory, with a 40% increase over the same period, highlighting its focus on efficiency and steady growth.
The data reveals a fascinating divergence in cost management strategies between these two industry titans. While Builders FirstSource, Inc. capitalized on market opportunities, Lennox International Inc. prioritized sustainable growth. This analysis underscores the importance of strategic cost management in navigating competitive markets.
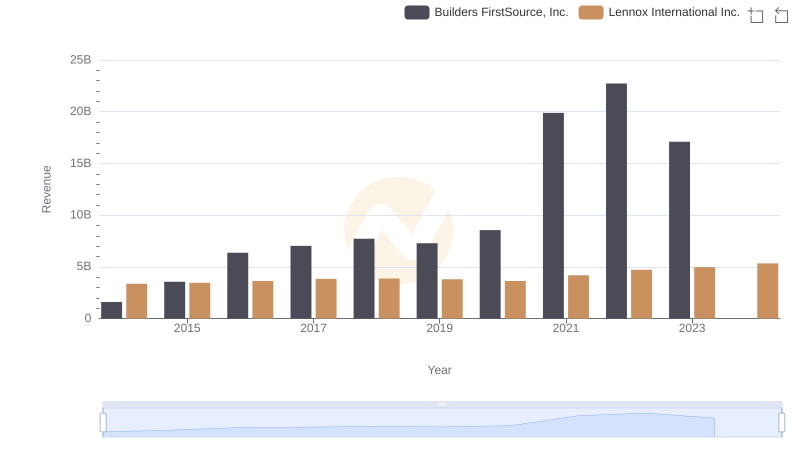
Lennox International Inc. and Builders FirstSource, Inc.: A Comprehensive Revenue Analysis
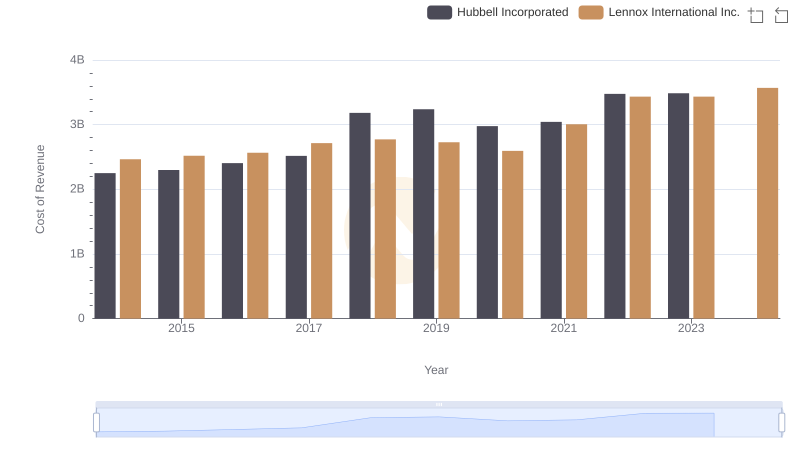
Cost of Revenue Comparison: Lennox International Inc. vs Hubbell Incorporated
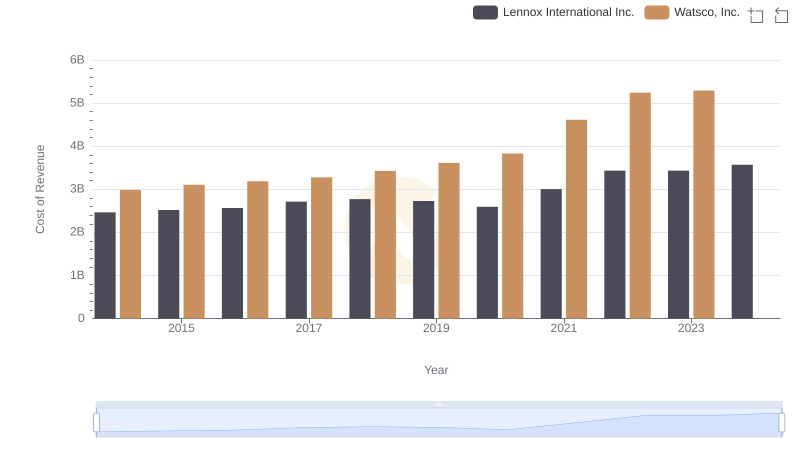
Cost of Revenue Trends: Lennox International Inc. vs Watsco, Inc.
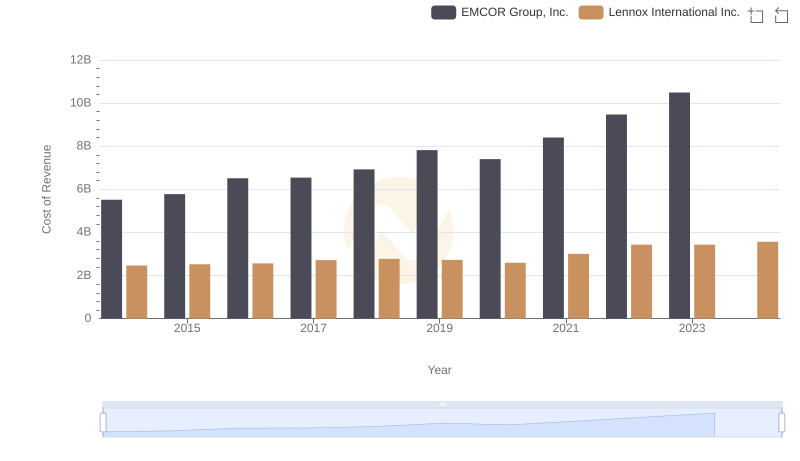
Comparing Cost of Revenue Efficiency: Lennox International Inc. vs EMCOR Group, Inc.
Analyzing Cost of Revenue: Lennox International Inc. and AerCap Holdings N.V.
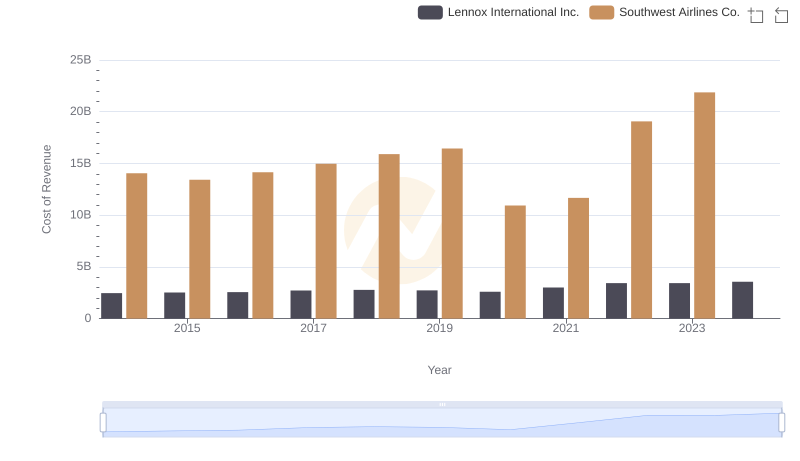
Comparing Cost of Revenue Efficiency: Lennox International Inc. vs Southwest Airlines Co.
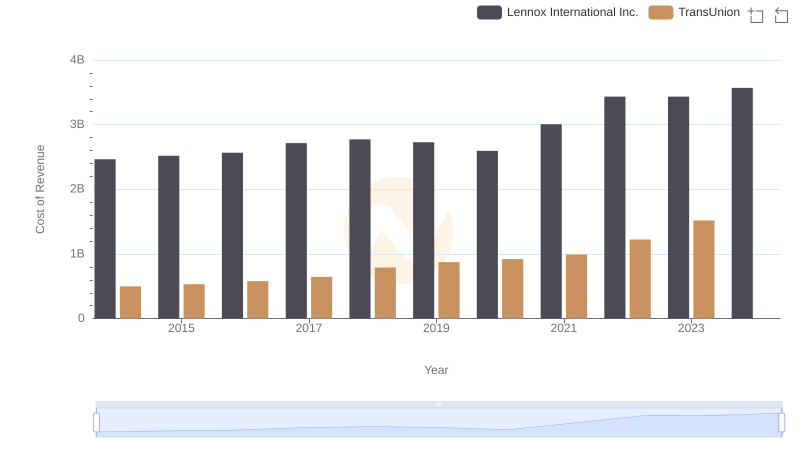
Comparing Cost of Revenue Efficiency: Lennox International Inc. vs TransUnion
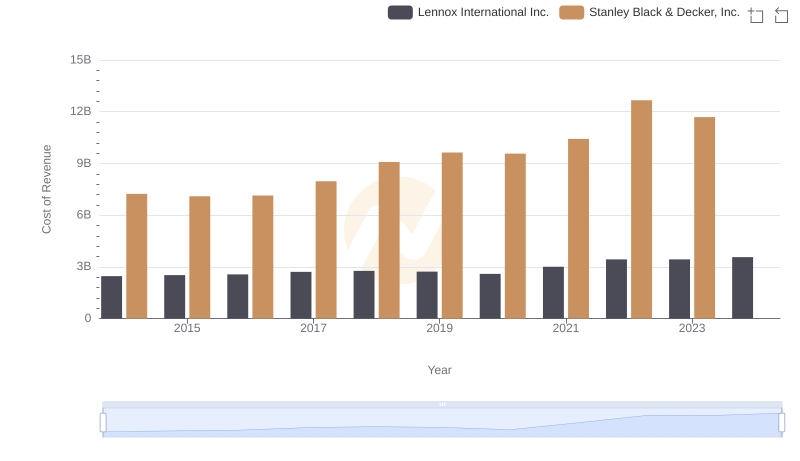
Lennox International Inc. vs Stanley Black & Decker, Inc.: Efficiency in Cost of Revenue Explored
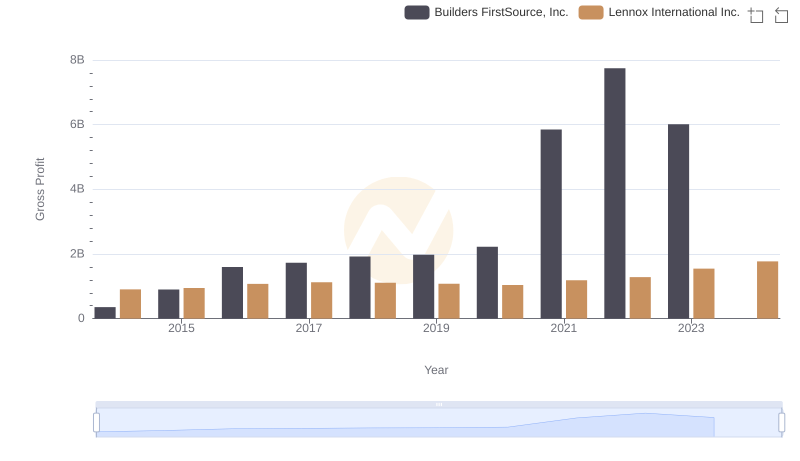
Gross Profit Trends Compared: Lennox International Inc. vs Builders FirstSource, Inc.
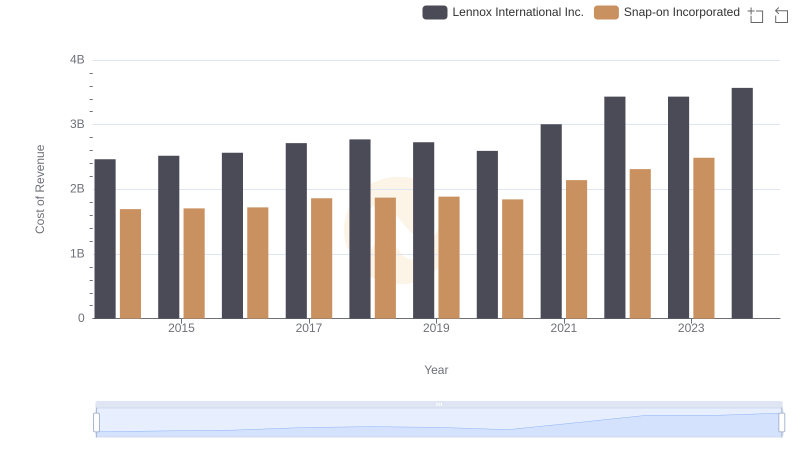
Cost Insights: Breaking Down Lennox International Inc. and Snap-on Incorporated's Expenses
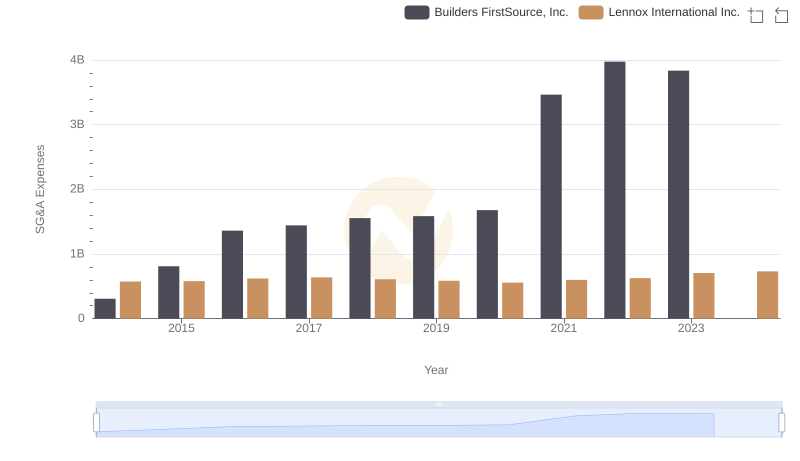
Lennox International Inc. or Builders FirstSource, Inc.: Who Manages SG&A Costs Better?
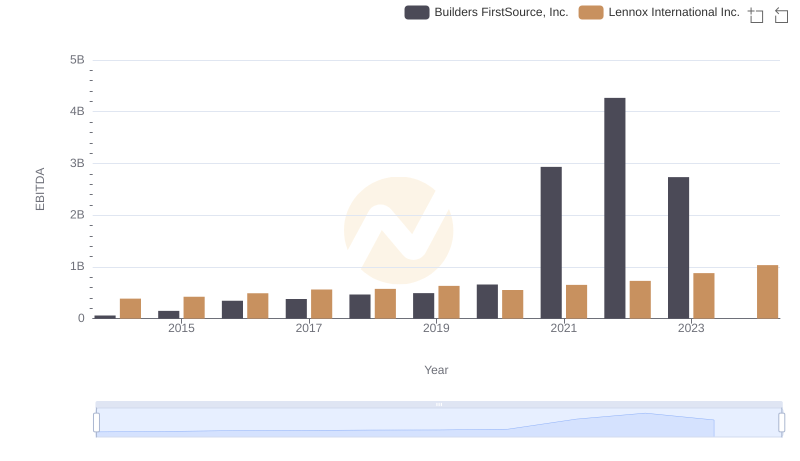
A Professional Review of EBITDA: Lennox International Inc. Compared to Builders FirstSource, Inc.