| __timestamp | Intuit Inc. | VMware, Inc. |
|---|---|---|
| Wednesday, January 1, 2014 | 3838000000 | 4477000000 |
| Thursday, January 1, 2015 | 3467000000 | 5118000000 |
| Friday, January 1, 2016 | 3942000000 | 5553000000 |
| Sunday, January 1, 2017 | 4368000000 | 6040000000 |
| Monday, January 1, 2018 | 4987000000 | 6781000000 |
| Tuesday, January 1, 2019 | 5617000000 | 7716000000 |
| Wednesday, January 1, 2020 | 6301000000 | 9012000000 |
| Friday, January 1, 2021 | 7950000000 | 9724000000 |
| Saturday, January 1, 2022 | 10320000000 | 10580000000 |
| Sunday, January 1, 2023 | 11225000000 | 10868000000 |
| Monday, January 1, 2024 | 12820000000 |
Unlocking the unknown
In the ever-evolving landscape of technology, Intuit Inc. and VMware, Inc. have demonstrated remarkable financial growth over the past decade. From 2014 to 2023, Intuit's gross profit surged by an impressive 234%, reflecting its robust business model and strategic innovations. Meanwhile, VMware's gross profit increased by 143% during the same period, showcasing its resilience and adaptability in a competitive market.
These trends highlight the dynamic nature of the tech industry and the strategic prowess of these two giants.
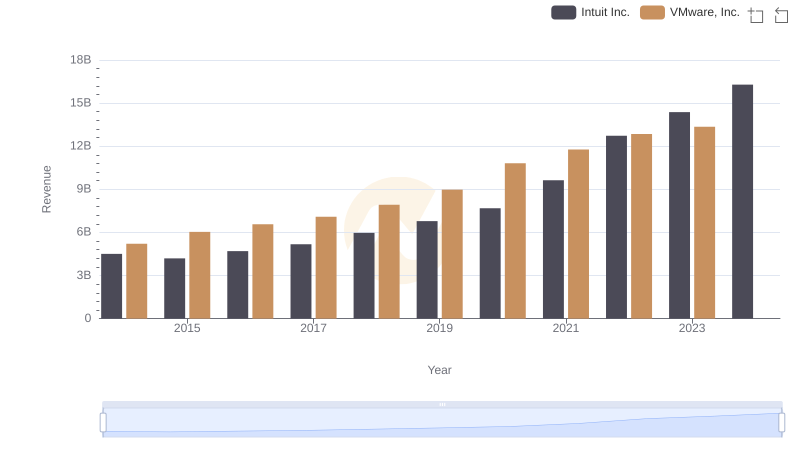
Intuit Inc. vs VMware, Inc.: Examining Key Revenue Metrics
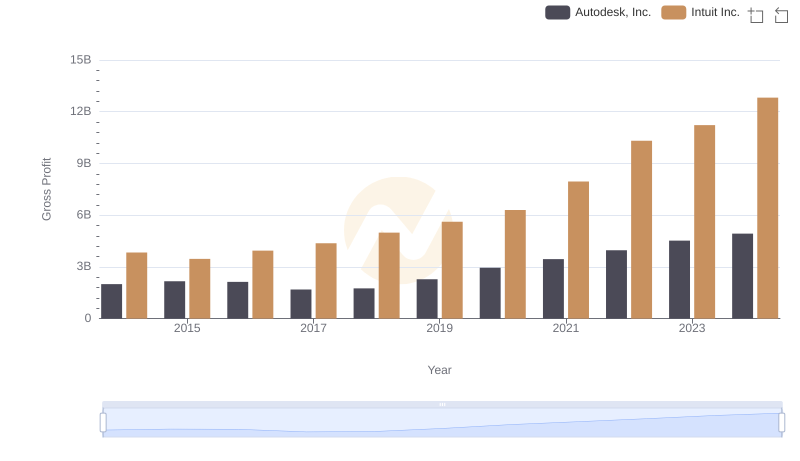
Key Insights on Gross Profit: Intuit Inc. vs Autodesk, Inc.
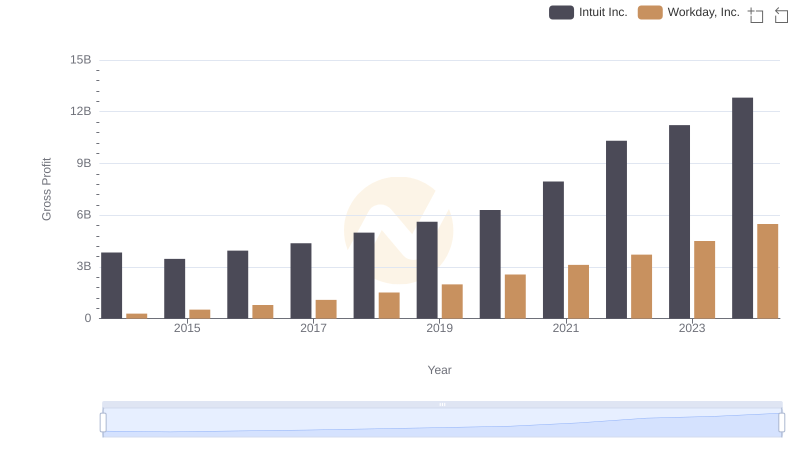
Gross Profit Comparison: Intuit Inc. and Workday, Inc. Trends
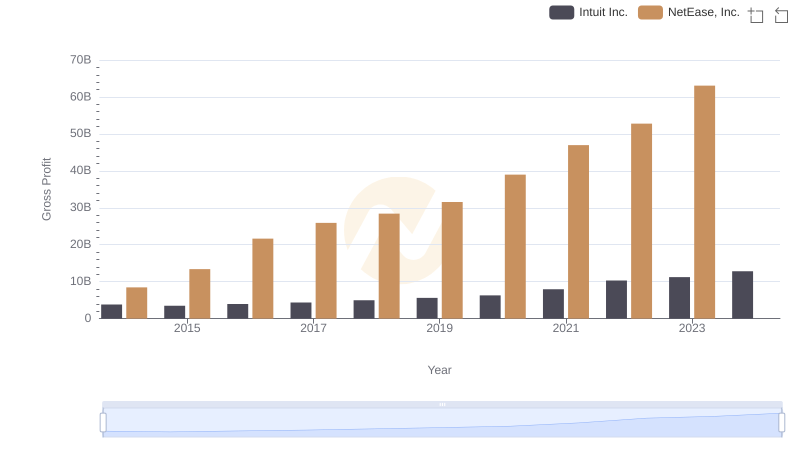
Who Generates Higher Gross Profit? Intuit Inc. or NetEase, Inc.
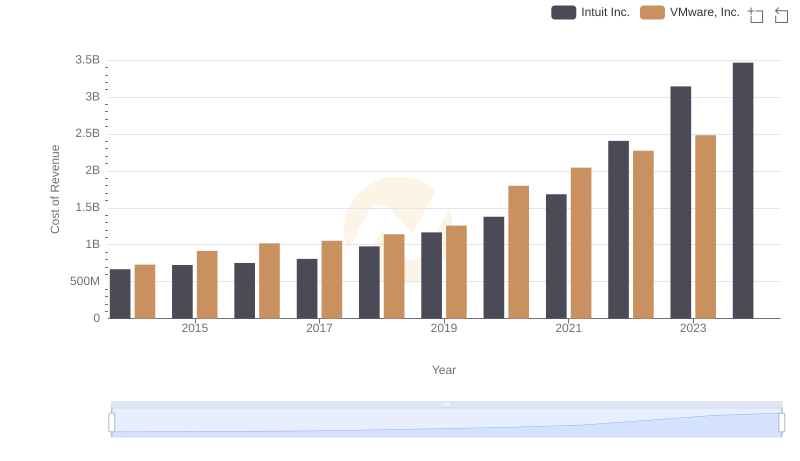
Analyzing Cost of Revenue: Intuit Inc. and VMware, Inc.
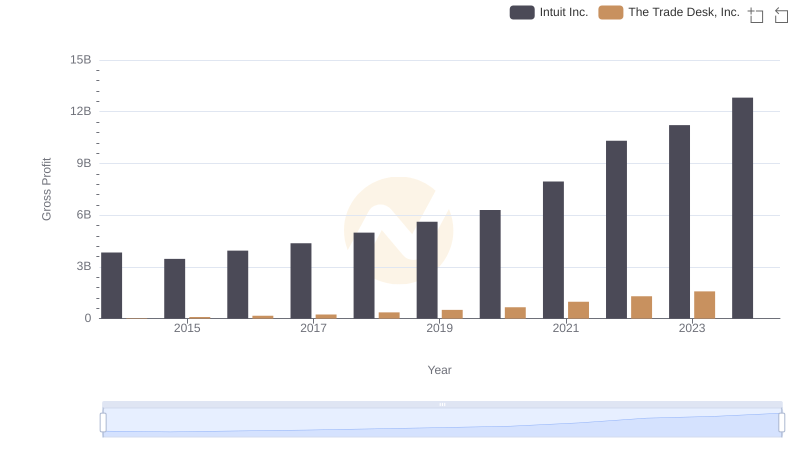
Gross Profit Comparison: Intuit Inc. and The Trade Desk, Inc. Trends
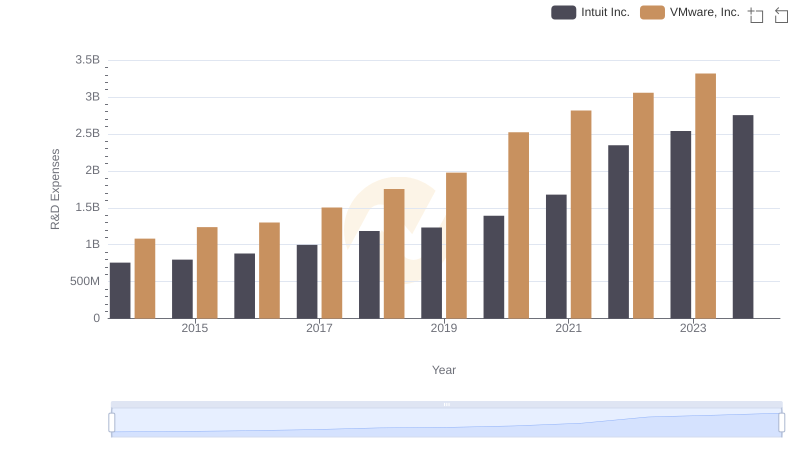
Intuit Inc. or VMware, Inc.: Who Invests More in Innovation?
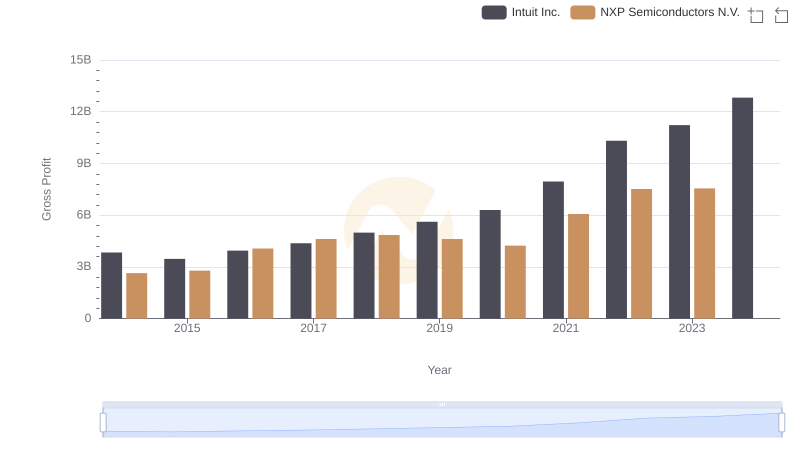
Gross Profit Trends Compared: Intuit Inc. vs NXP Semiconductors N.V.
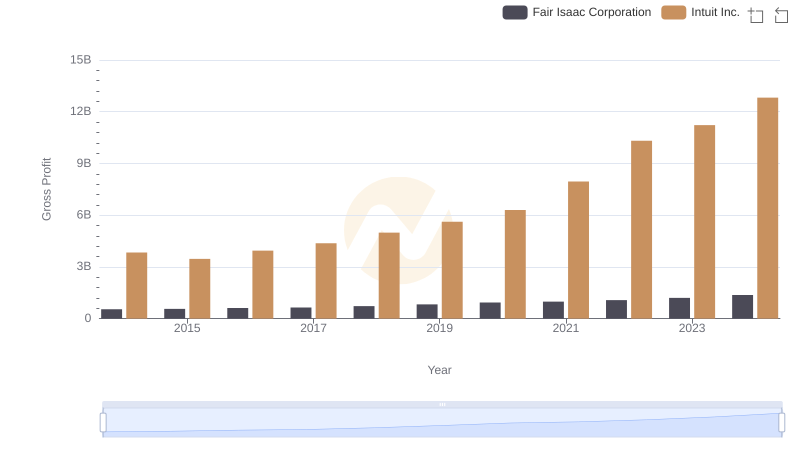
Intuit Inc. and Fair Isaac Corporation: A Detailed Gross Profit Analysis
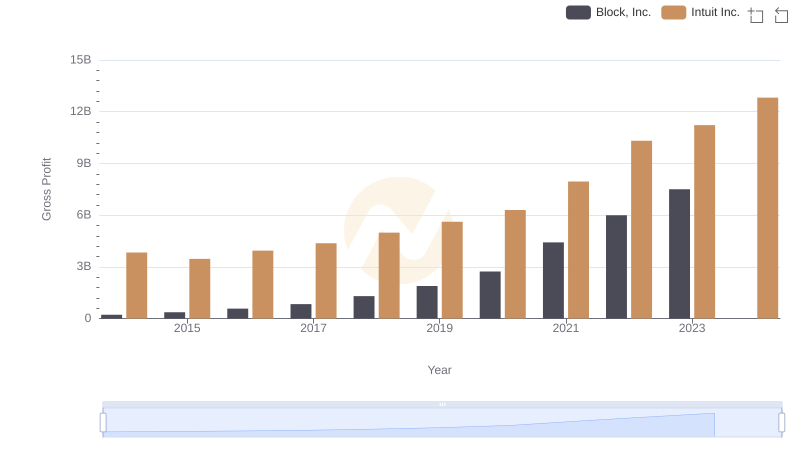
Gross Profit Comparison: Intuit Inc. and Block, Inc. Trends
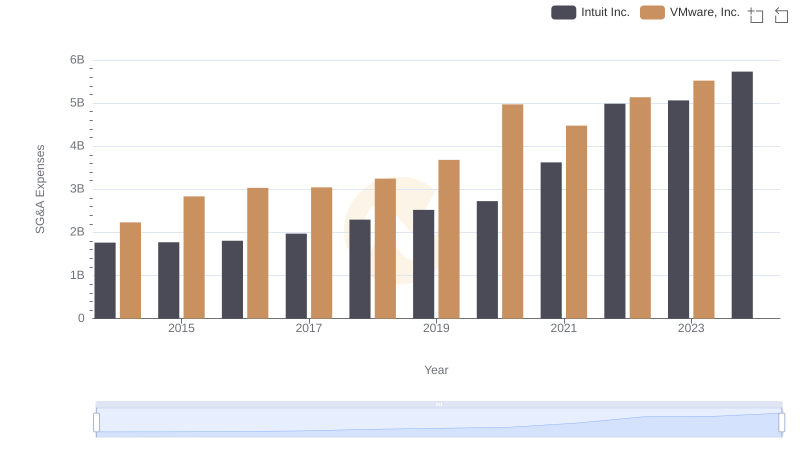
Cost Management Insights: SG&A Expenses for Intuit Inc. and VMware, Inc.
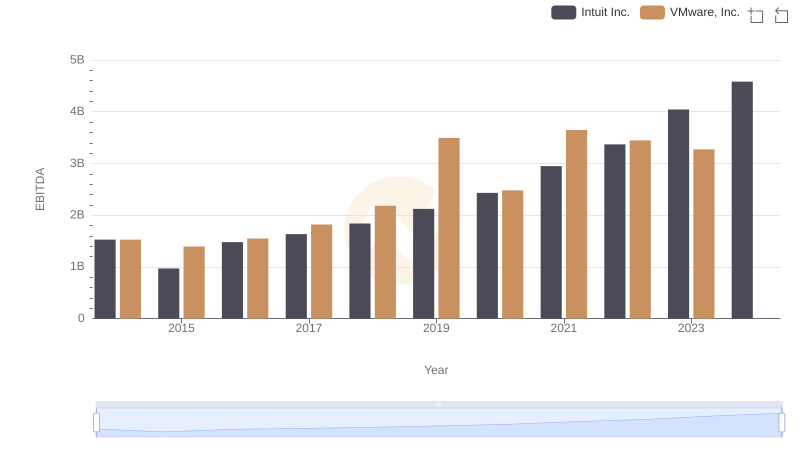
EBITDA Analysis: Evaluating Intuit Inc. Against VMware, Inc.