| __timestamp | Block, Inc. | Intuit Inc. |
|---|---|---|
| Wednesday, January 1, 2014 | 226074000 | 3838000000 |
| Thursday, January 1, 2015 | 370030000 | 3467000000 |
| Friday, January 1, 2016 | 576038000 | 3942000000 |
| Sunday, January 1, 2017 | 839306000 | 4368000000 |
| Monday, January 1, 2018 | 1303700000 | 4987000000 |
| Tuesday, January 1, 2019 | 1889685000 | 5617000000 |
| Wednesday, January 1, 2020 | 2733409000 | 6301000000 |
| Friday, January 1, 2021 | 4419823000 | 7950000000 |
| Saturday, January 1, 2022 | 5991892000 | 10320000000 |
| Sunday, January 1, 2023 | 7504886000 | 11225000000 |
| Monday, January 1, 2024 | 12820000000 |
Unveiling the hidden dimensions of data
In the ever-evolving landscape of financial technology, Intuit Inc. and Block, Inc. (formerly known as Square) have emerged as formidable players. Over the past decade, these companies have demonstrated remarkable growth in their gross profits, reflecting their strategic prowess and market adaptability.
From 2014 to 2023, Intuit Inc. has consistently outperformed Block, Inc., with its gross profit growing by approximately 193%. In contrast, Block, Inc. has shown an impressive growth trajectory, with its gross profit surging by over 3,200% during the same period. This stark difference highlights Intuit's steady expansion and Block's rapid ascent in the fintech arena.
While Intuit's gross profit reached a peak of $12.82 billion in 2024, Block's data for the same year remains unavailable, leaving room for speculation about its continued growth. As these companies continue to innovate, their financial journeys offer valuable insights into the future of fintech.
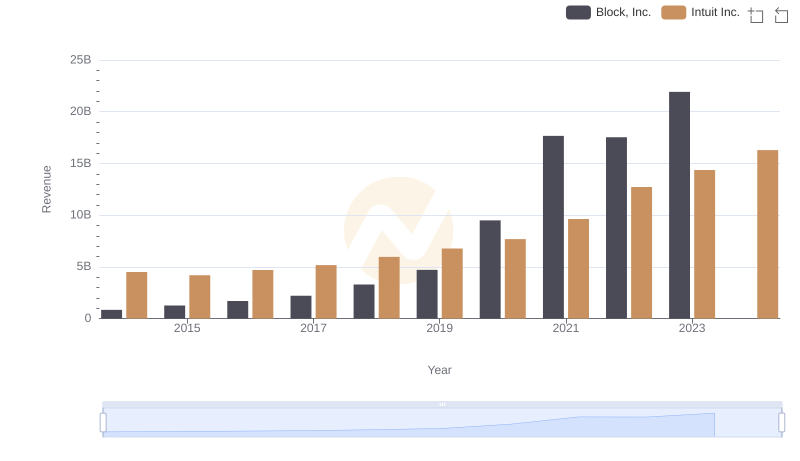
Breaking Down Revenue Trends: Intuit Inc. vs Block, Inc.
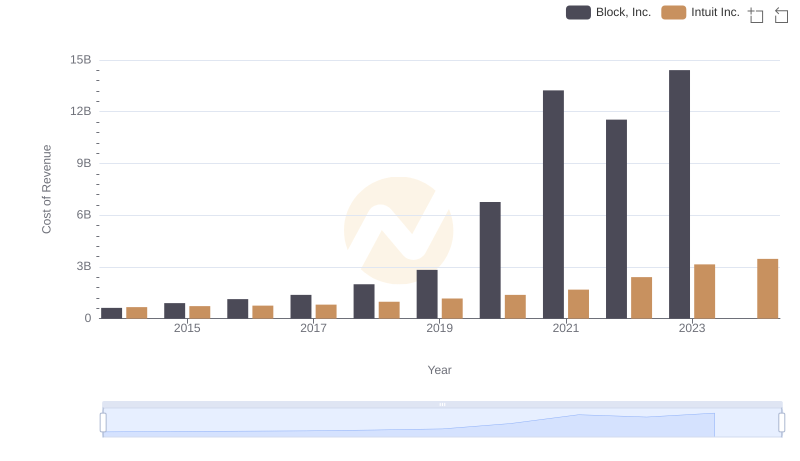
Cost Insights: Breaking Down Intuit Inc. and Block, Inc.'s Expenses
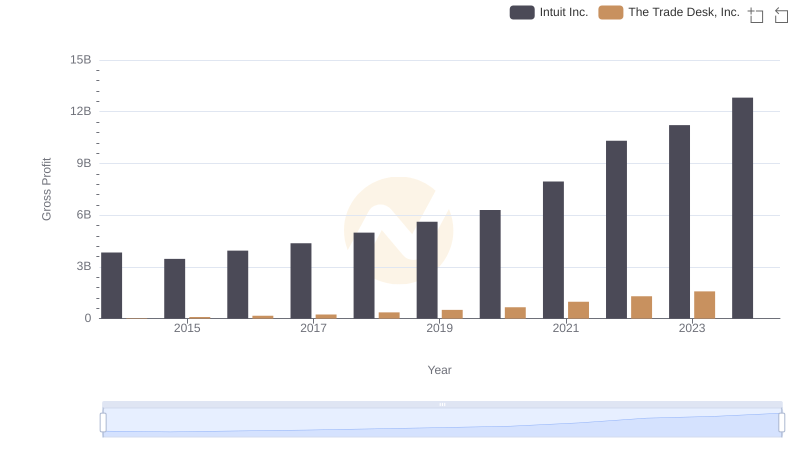
Gross Profit Comparison: Intuit Inc. and The Trade Desk, Inc. Trends
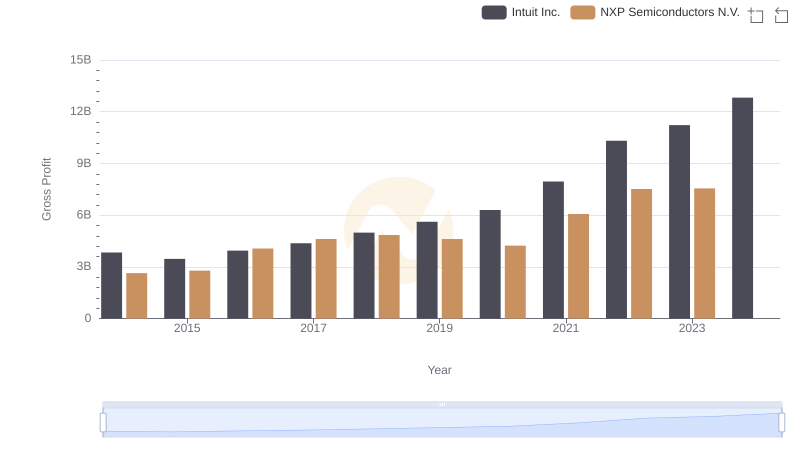
Gross Profit Trends Compared: Intuit Inc. vs NXP Semiconductors N.V.
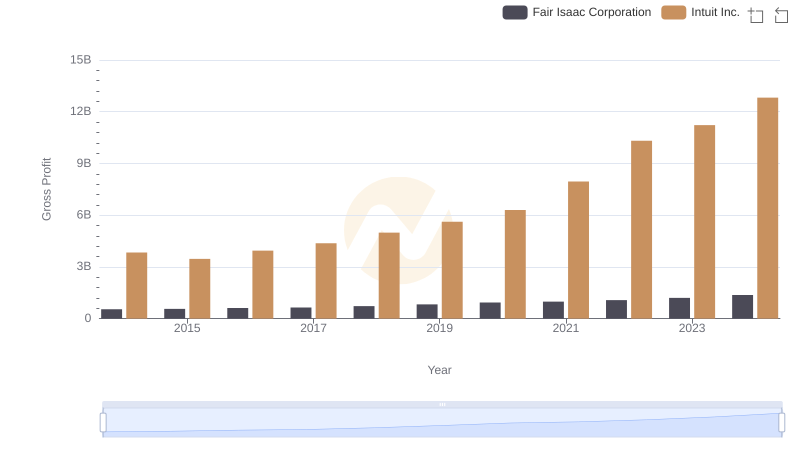
Intuit Inc. and Fair Isaac Corporation: A Detailed Gross Profit Analysis
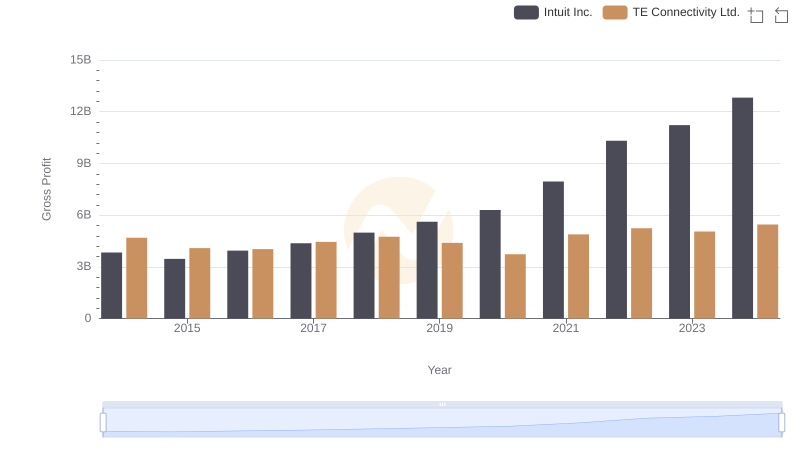
Intuit Inc. vs TE Connectivity Ltd.: A Gross Profit Performance Breakdown
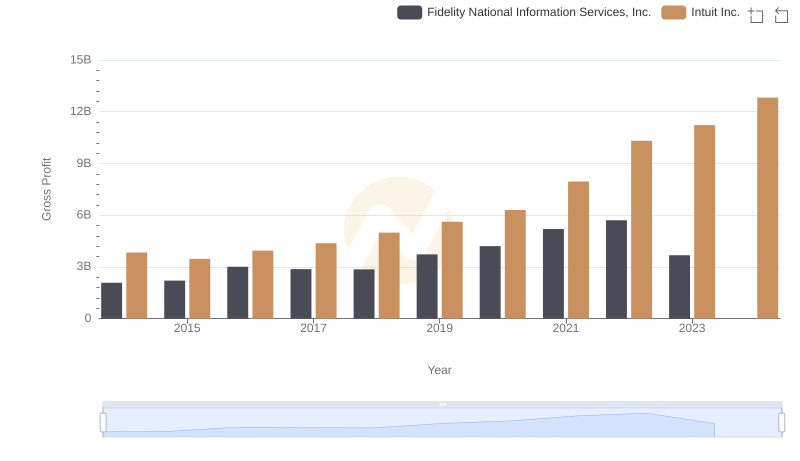
Gross Profit Analysis: Comparing Intuit Inc. and Fidelity National Information Services, Inc.
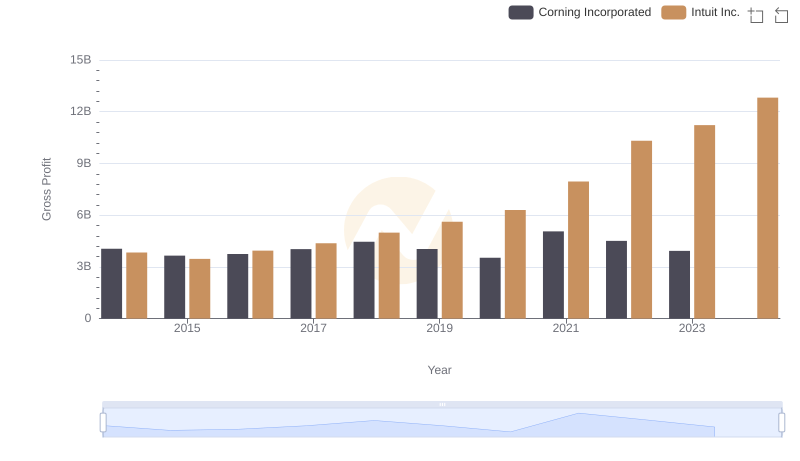
Gross Profit Trends Compared: Intuit Inc. vs Corning Incorporated
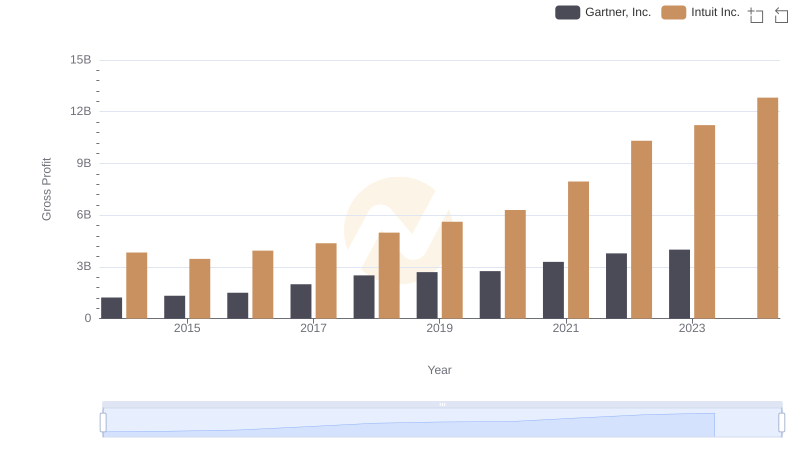
Who Generates Higher Gross Profit? Intuit Inc. or Gartner, Inc.
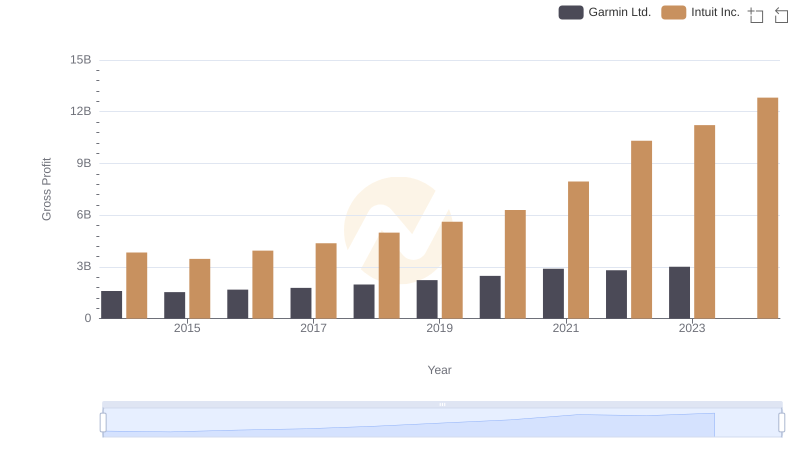
Intuit Inc. vs Garmin Ltd.: A Gross Profit Performance Breakdown
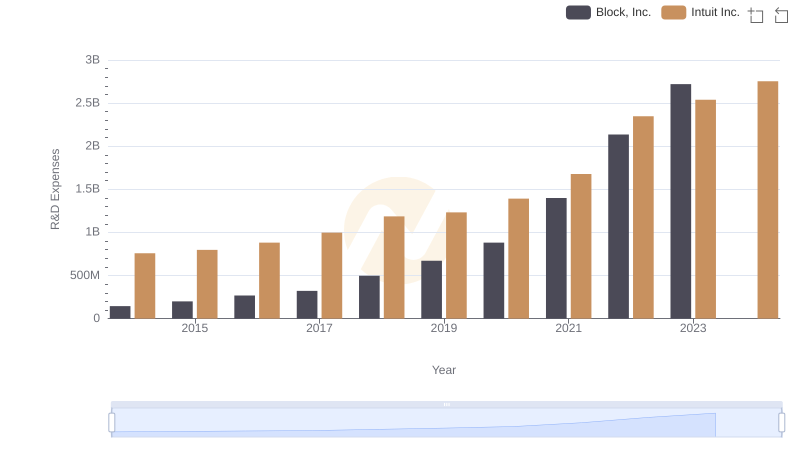
Comparing Innovation Spending: Intuit Inc. and Block, Inc.
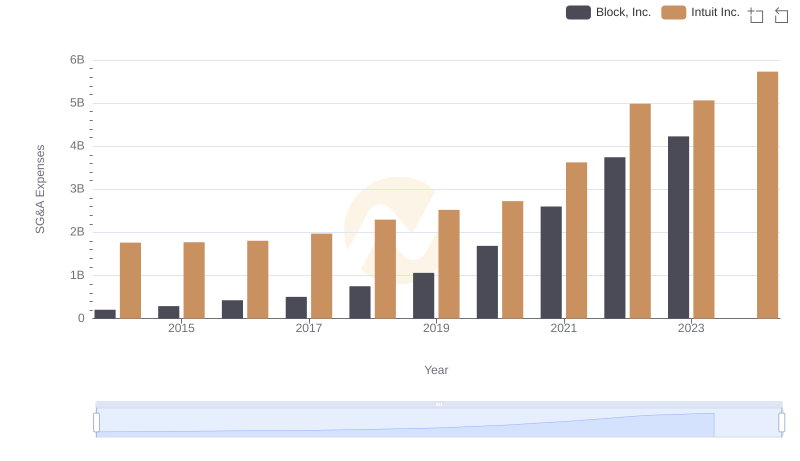
Intuit Inc. vs Block, Inc.: SG&A Expense Trends