| __timestamp | Cintas Corporation | Johnson Controls International plc |
|---|---|---|
| Wednesday, January 1, 2014 | 1914386000 | 6627000000 |
| Thursday, January 1, 2015 | 1921337000 | 6447000000 |
| Friday, January 1, 2016 | 2129870000 | 5654000000 |
| Sunday, January 1, 2017 | 2380295000 | 9339000000 |
| Monday, January 1, 2018 | 2908523000 | 9380000000 |
| Tuesday, January 1, 2019 | 3128588000 | 7693000000 |
| Wednesday, January 1, 2020 | 3233748000 | 7411000000 |
| Friday, January 1, 2021 | 3314651000 | 8059000000 |
| Saturday, January 1, 2022 | 3632246000 | 8343000000 |
| Sunday, January 1, 2023 | 4173368000 | 8971000000 |
| Monday, January 1, 2024 | 4686416000 | 8077000000 |
In pursuit of knowledge
In the ever-evolving landscape of corporate finance, understanding the gross profit trends of industry leaders like Cintas Corporation and Johnson Controls International plc offers invaluable insights. Over the past decade, Cintas has demonstrated a remarkable growth trajectory, with its gross profit surging by approximately 145% from 2014 to 2024. This growth reflects Cintas's strategic expansion and operational efficiency.
Conversely, Johnson Controls, while maintaining a robust gross profit, has experienced fluctuations. Notably, its gross profit peaked in 2018, reaching nearly 9.4 billion, before stabilizing around 8 billion in recent years. This trend underscores the challenges and opportunities faced by multinational corporations in adapting to global market dynamics.
As we look to the future, these trends highlight the importance of strategic agility and innovation in sustaining financial growth. Investors and analysts alike should keep a keen eye on these developments as they unfold.
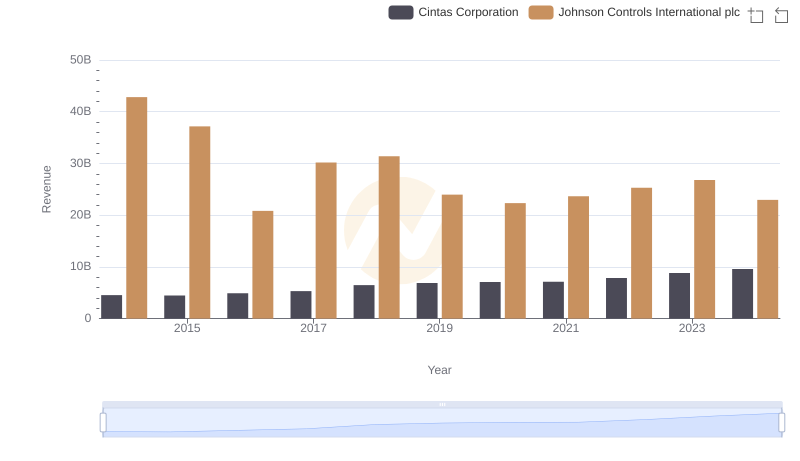
Comparing Revenue Performance: Cintas Corporation or Johnson Controls International plc?
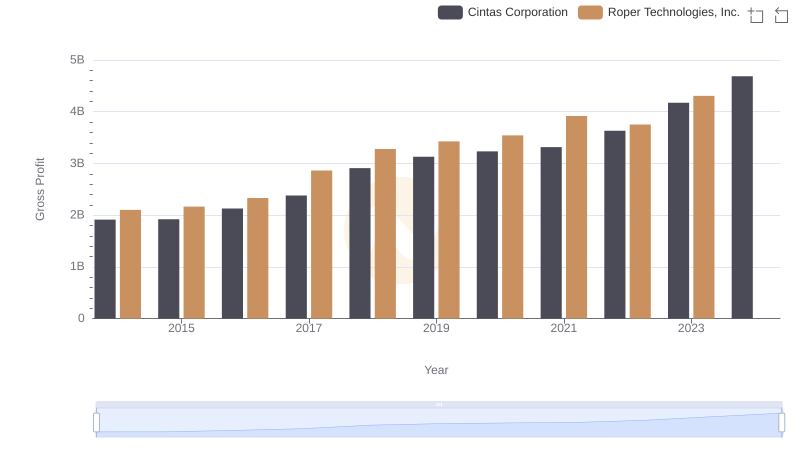
Key Insights on Gross Profit: Cintas Corporation vs Roper Technologies, Inc.
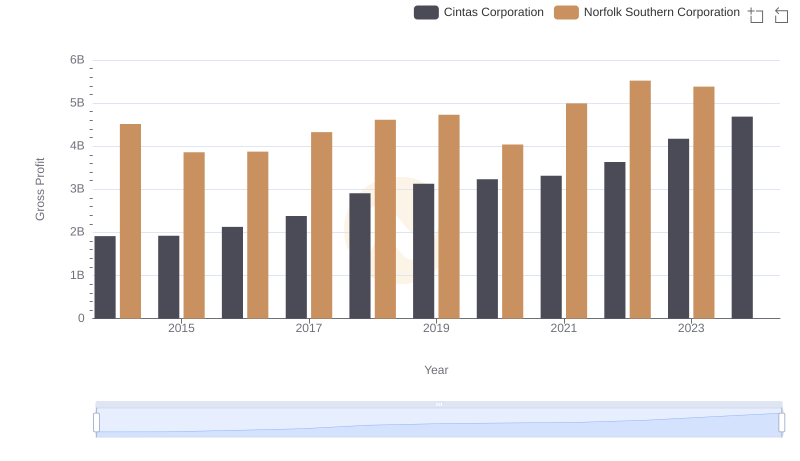
Gross Profit Analysis: Comparing Cintas Corporation and Norfolk Southern Corporation
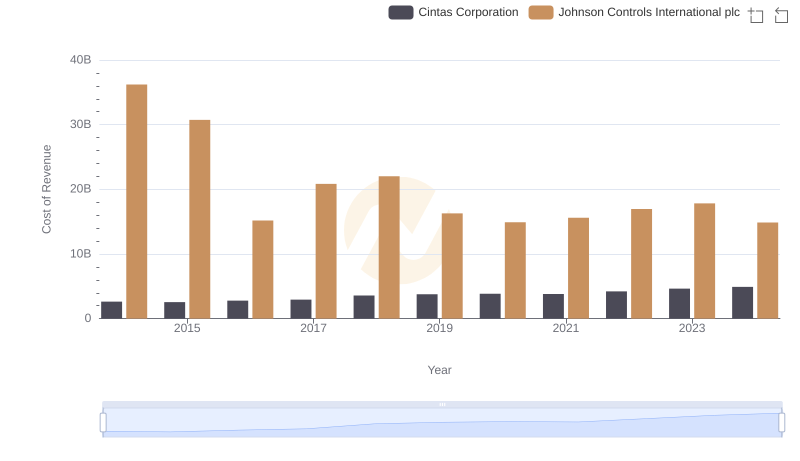
Cost of Revenue: Key Insights for Cintas Corporation and Johnson Controls International plc
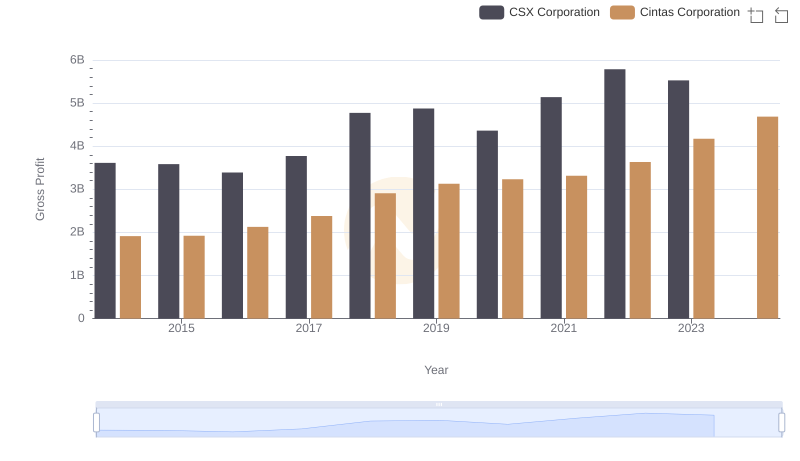
Cintas Corporation vs CSX Corporation: A Gross Profit Performance Breakdown
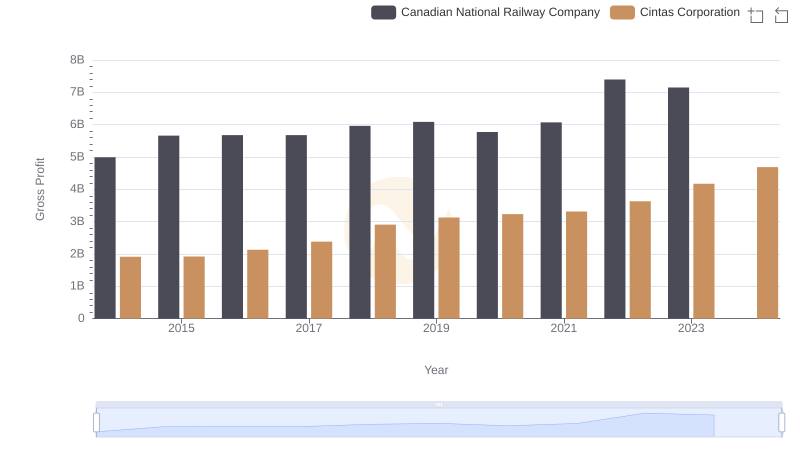
Gross Profit Trends Compared: Cintas Corporation vs Canadian National Railway Company
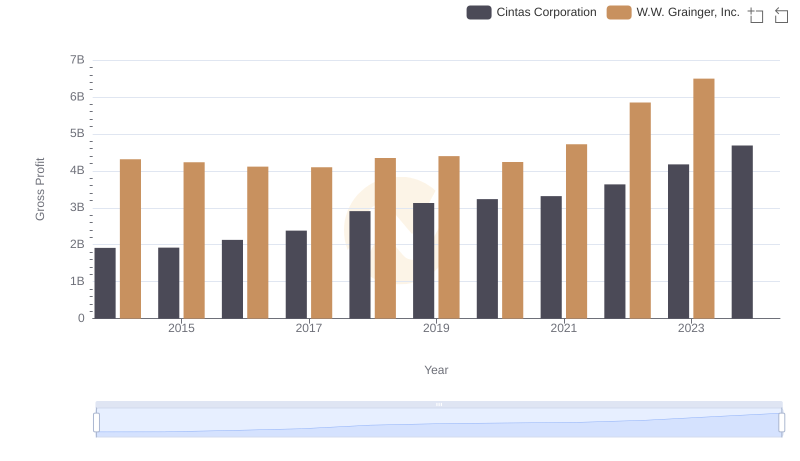
Who Generates Higher Gross Profit? Cintas Corporation or W.W. Grainger, Inc.
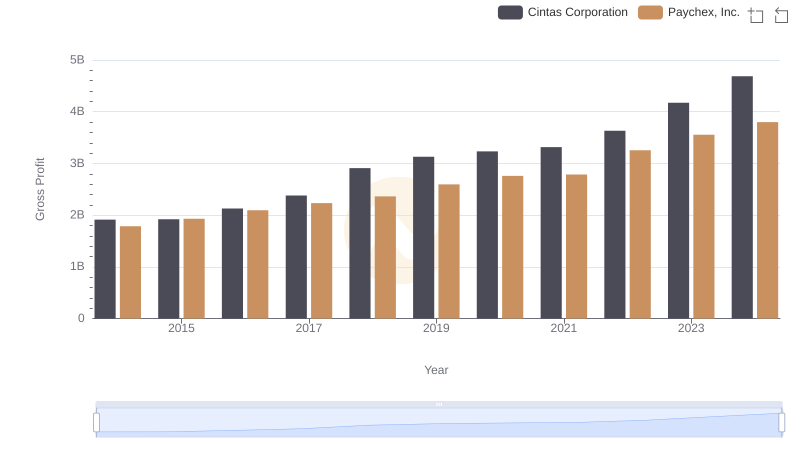
Key Insights on Gross Profit: Cintas Corporation vs Paychex, Inc.
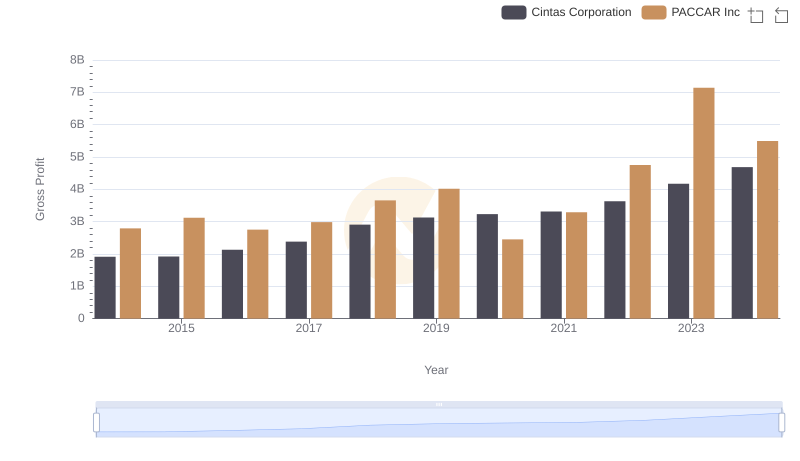
Gross Profit Comparison: Cintas Corporation and PACCAR Inc Trends
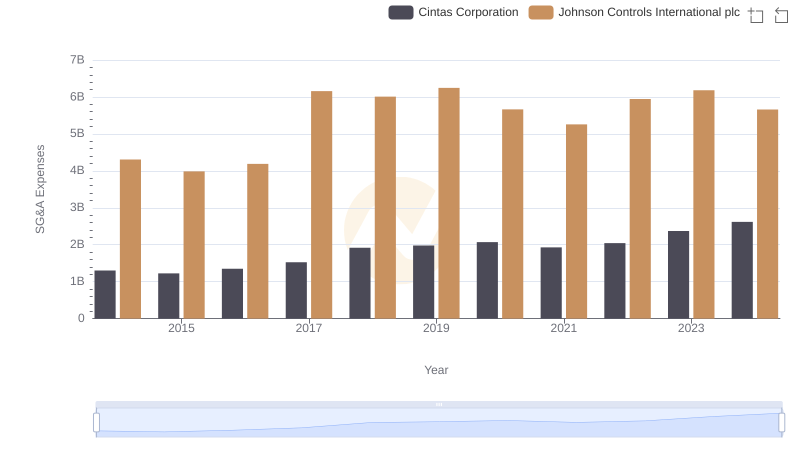
Cintas Corporation and Johnson Controls International plc: SG&A Spending Patterns Compared
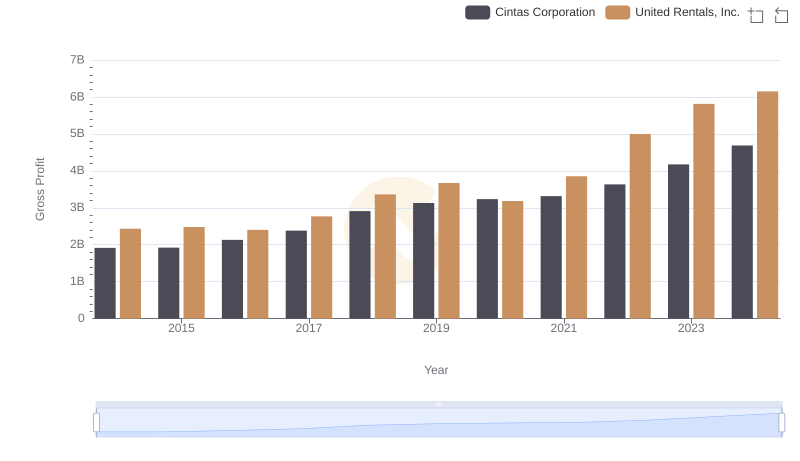
Gross Profit Analysis: Comparing Cintas Corporation and United Rentals, Inc.
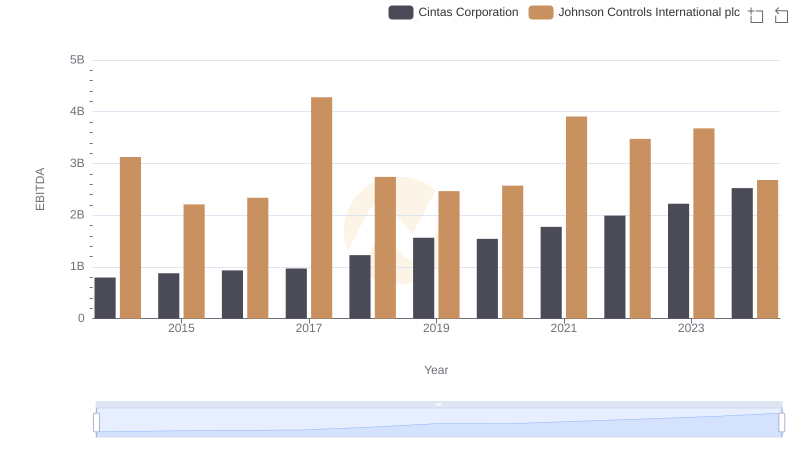
EBITDA Performance Review: Cintas Corporation vs Johnson Controls International plc