| __timestamp | Cintas Corporation | Johnson Controls International plc |
|---|---|---|
| Wednesday, January 1, 2014 | 1302752000 | 4308000000 |
| Thursday, January 1, 2015 | 1224930000 | 3986000000 |
| Friday, January 1, 2016 | 1348122000 | 4190000000 |
| Sunday, January 1, 2017 | 1527380000 | 6158000000 |
| Monday, January 1, 2018 | 1916792000 | 6010000000 |
| Tuesday, January 1, 2019 | 1980644000 | 6244000000 |
| Wednesday, January 1, 2020 | 2071052000 | 5665000000 |
| Friday, January 1, 2021 | 1929159000 | 5258000000 |
| Saturday, January 1, 2022 | 2044876000 | 5945000000 |
| Sunday, January 1, 2023 | 2370704000 | 6181000000 |
| Monday, January 1, 2024 | 2617783000 | 5661000000 |
Infusing magic into the data realm
In the world of corporate finance, understanding the nuances of Selling, General, and Administrative (SG&A) expenses is crucial. Over the past decade, Cintas Corporation and Johnson Controls International plc have showcased distinct spending patterns. From 2014 to 2024, Cintas Corporation's SG&A expenses surged by approximately 101%, reflecting a strategic expansion and operational scaling. In contrast, Johnson Controls experienced a more modest 32% increase, peaking in 2019 before stabilizing.
Cintas, known for its uniform services, has consistently increased its SG&A spending, indicating aggressive growth and market penetration strategies. Meanwhile, Johnson Controls, a leader in building technologies, has maintained a steady approach, focusing on efficiency and consolidation. This divergence highlights the varied strategies companies employ to navigate market challenges and opportunities.
Understanding these trends offers valuable insights into corporate strategies and financial health, making it essential for investors and analysts alike.
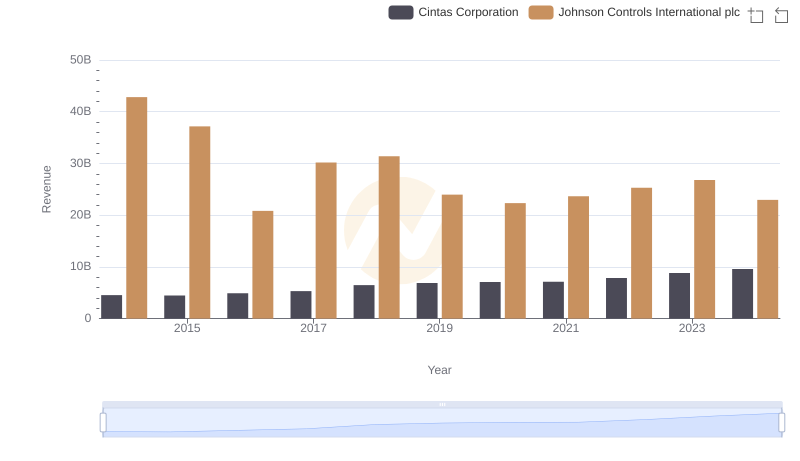
Comparing Revenue Performance: Cintas Corporation or Johnson Controls International plc?
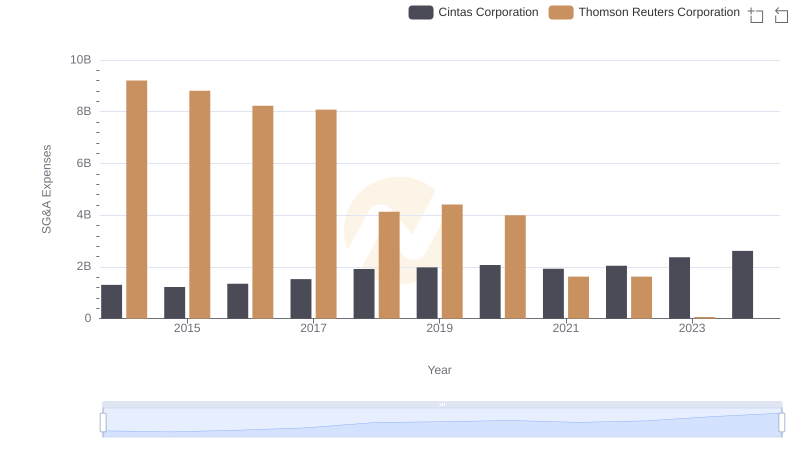
Cost Management Insights: SG&A Expenses for Cintas Corporation and Thomson Reuters Corporation
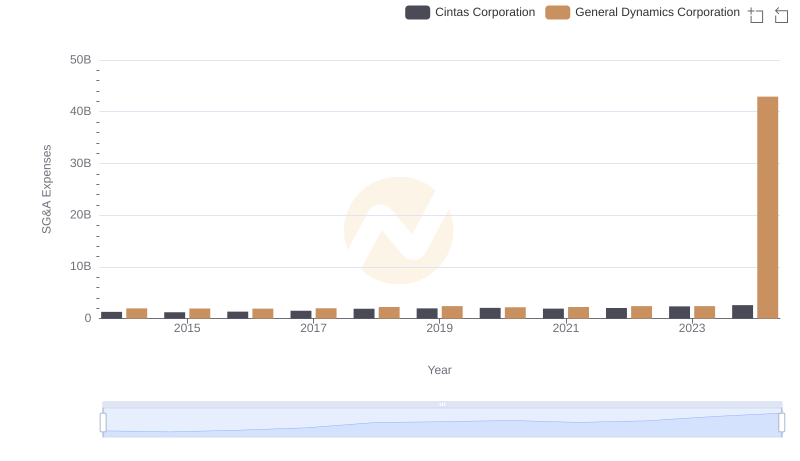
Comparing SG&A Expenses: Cintas Corporation vs General Dynamics Corporation Trends and Insights
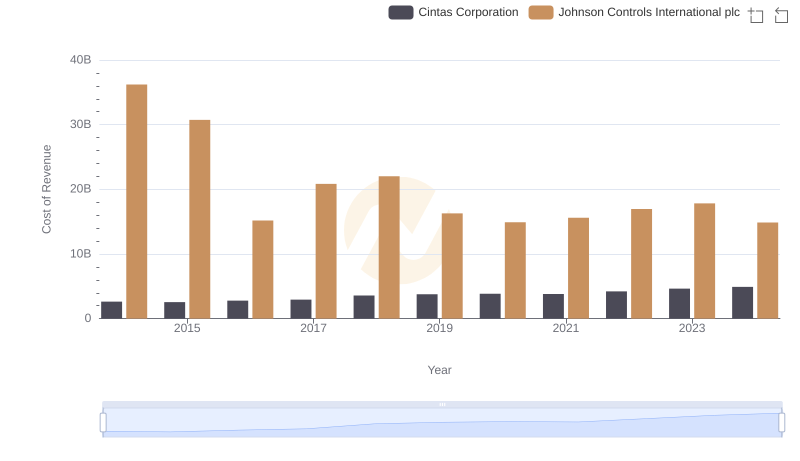
Cost of Revenue: Key Insights for Cintas Corporation and Johnson Controls International plc
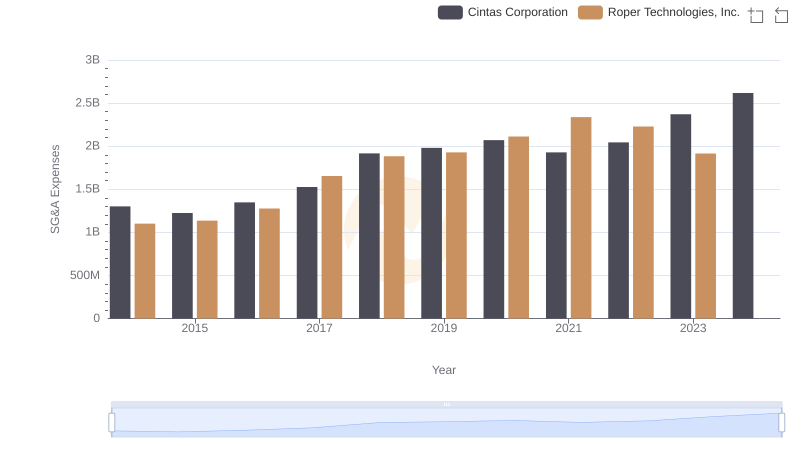
Comparing SG&A Expenses: Cintas Corporation vs Roper Technologies, Inc. Trends and Insights
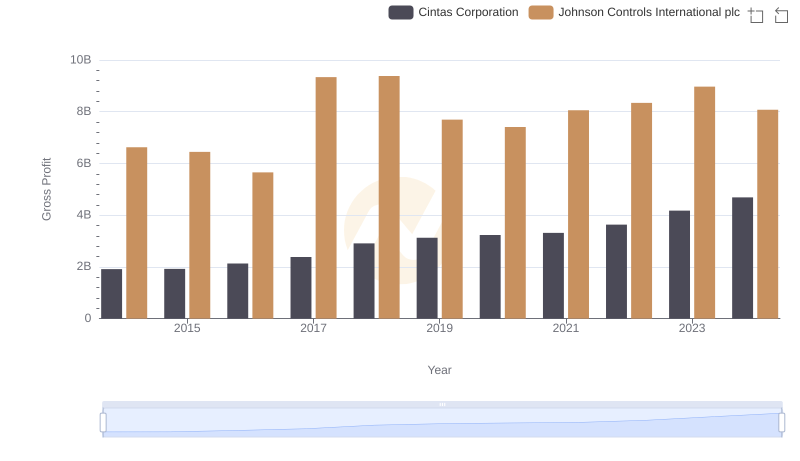
Gross Profit Trends Compared: Cintas Corporation vs Johnson Controls International plc
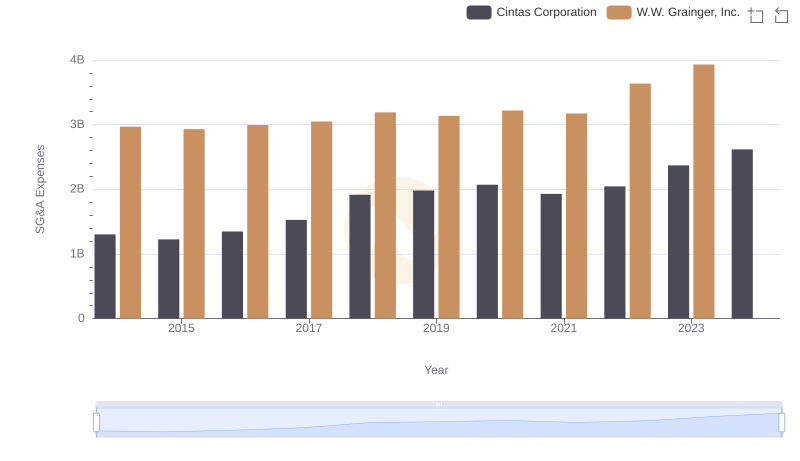
Cintas Corporation vs W.W. Grainger, Inc.: SG&A Expense Trends
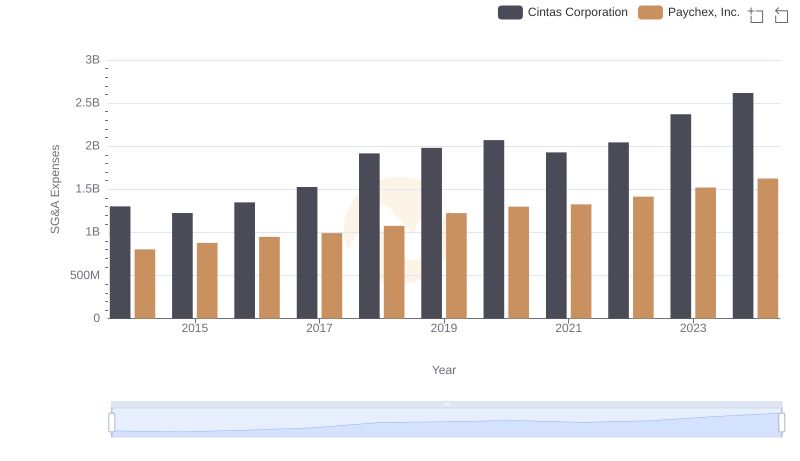
Comparing SG&A Expenses: Cintas Corporation vs Paychex, Inc. Trends and Insights
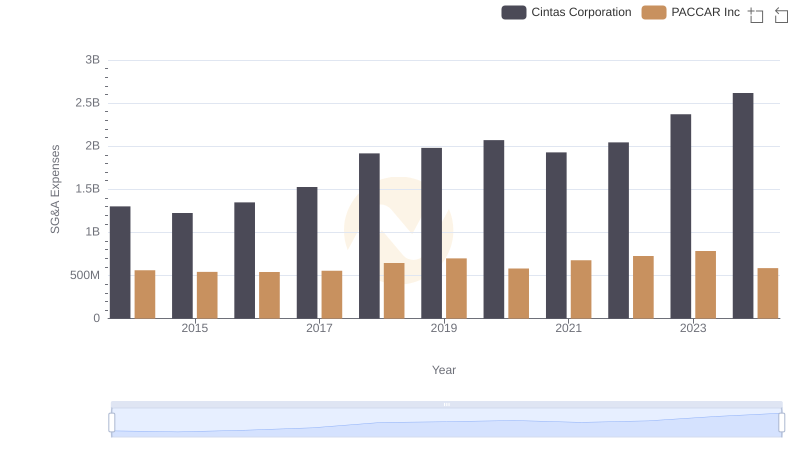
Cost Management Insights: SG&A Expenses for Cintas Corporation and PACCAR Inc
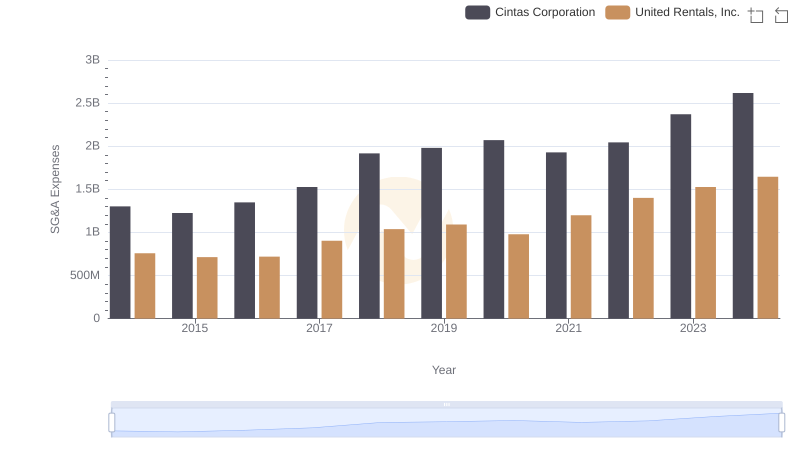
Cost Management Insights: SG&A Expenses for Cintas Corporation and United Rentals, Inc.
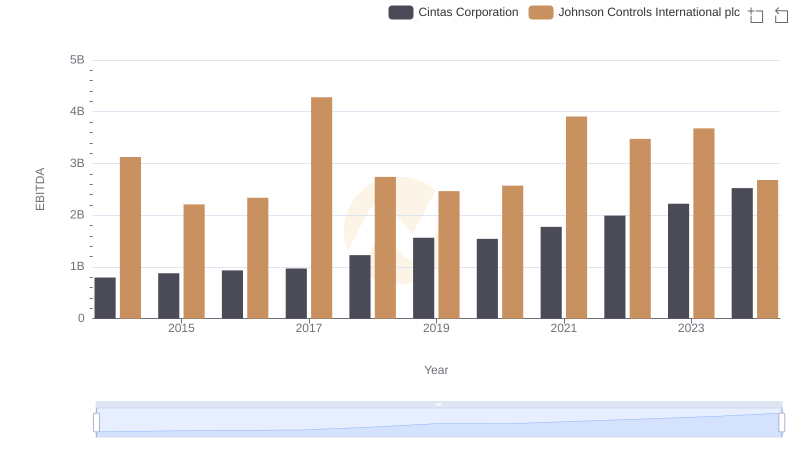
EBITDA Performance Review: Cintas Corporation vs Johnson Controls International plc