| __timestamp | Cintas Corporation | Johnson Controls International plc |
|---|---|---|
| Wednesday, January 1, 2014 | 793811000 | 3125000000 |
| Thursday, January 1, 2015 | 877761000 | 2209000000 |
| Friday, January 1, 2016 | 933728000 | 2338000000 |
| Sunday, January 1, 2017 | 968293000 | 4280000000 |
| Monday, January 1, 2018 | 1227852000 | 2741000000 |
| Tuesday, January 1, 2019 | 1564228000 | 2466000000 |
| Wednesday, January 1, 2020 | 1542737000 | 2572000000 |
| Friday, January 1, 2021 | 1773591000 | 3907000000 |
| Saturday, January 1, 2022 | 1990046000 | 3474000000 |
| Sunday, January 1, 2023 | 2221676000 | 3678000000 |
| Monday, January 1, 2024 | 2523857000 | 2800000000 |
In pursuit of knowledge
In the competitive landscape of corporate finance, EBITDA serves as a crucial indicator of a company's operational efficiency. This analysis juxtaposes the EBITDA performance of Cintas Corporation and Johnson Controls International plc from 2014 to 2024.
Cintas Corporation has demonstrated a robust upward trajectory, with its EBITDA growing by approximately 218% over the decade. Starting at around $794 million in 2014, it reached a peak of $2.52 billion in 2024. This consistent growth underscores Cintas's strategic prowess in enhancing operational efficiency and expanding market reach.
Conversely, Johnson Controls International plc experienced a more volatile journey. Despite a strong start in 2014 with an EBITDA of $3.13 billion, fluctuations were evident, peaking at $4.28 billion in 2017 before settling at $2.68 billion in 2024. This variability highlights the challenges faced in maintaining steady growth amidst market dynamics.
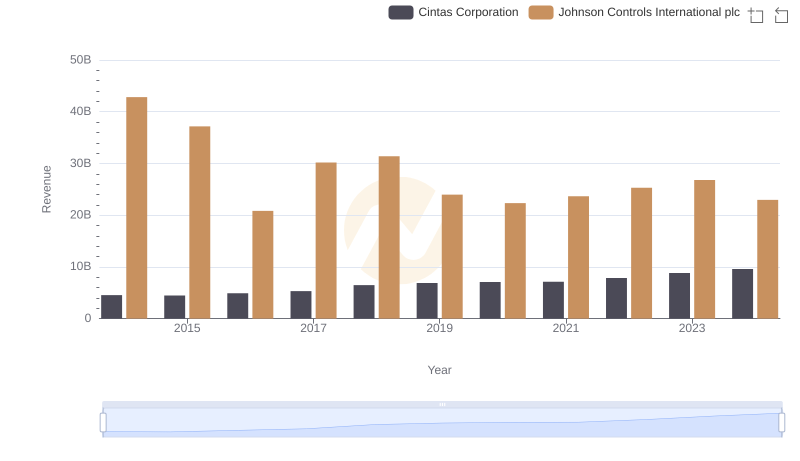
Comparing Revenue Performance: Cintas Corporation or Johnson Controls International plc?
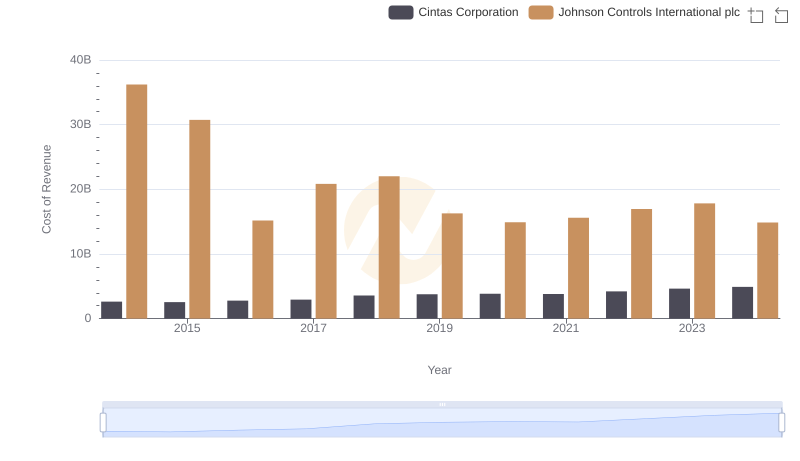
Cost of Revenue: Key Insights for Cintas Corporation and Johnson Controls International plc
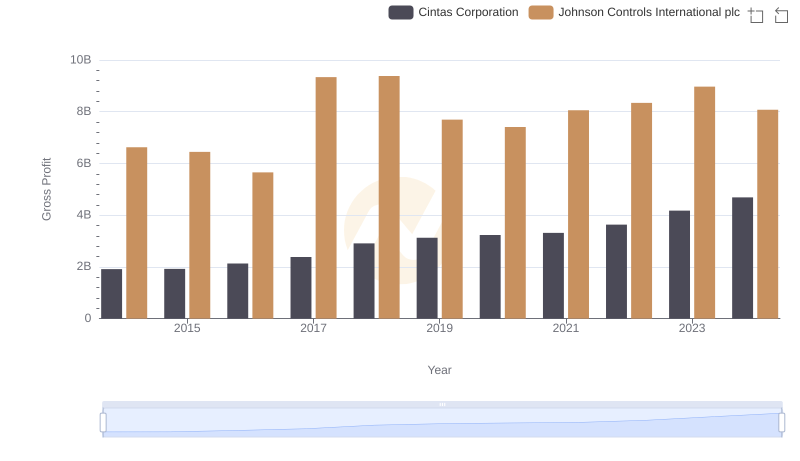
Gross Profit Trends Compared: Cintas Corporation vs Johnson Controls International plc
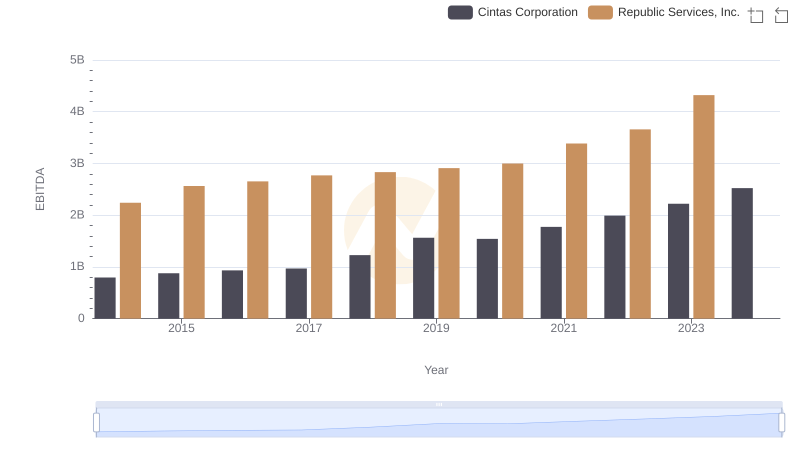
Cintas Corporation and Republic Services, Inc.: A Detailed Examination of EBITDA Performance
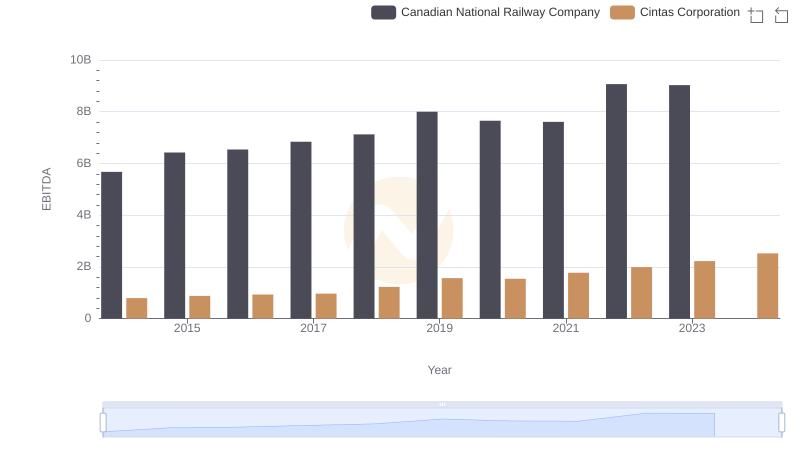
Professional EBITDA Benchmarking: Cintas Corporation vs Canadian National Railway Company
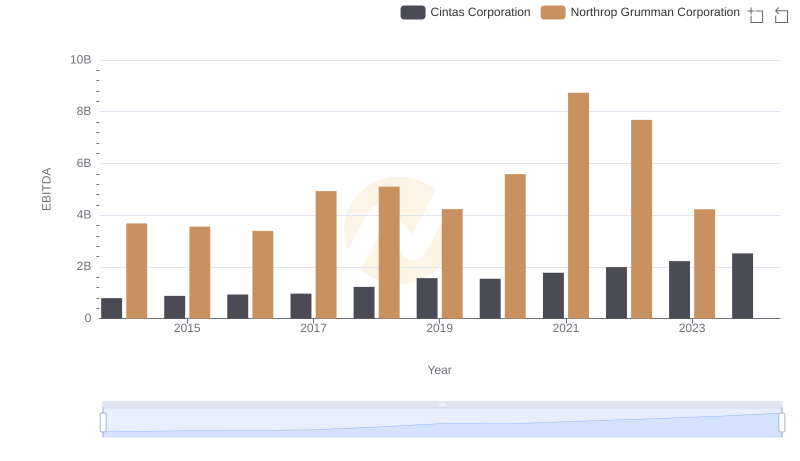
Comparative EBITDA Analysis: Cintas Corporation vs Northrop Grumman Corporation
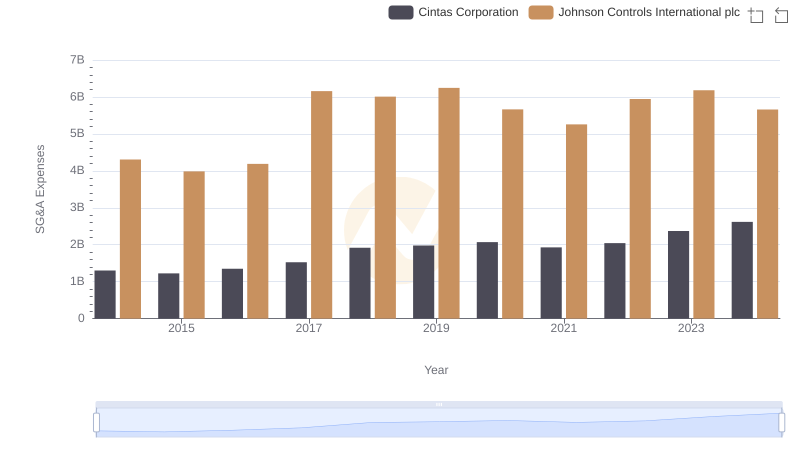
Cintas Corporation and Johnson Controls International plc: SG&A Spending Patterns Compared
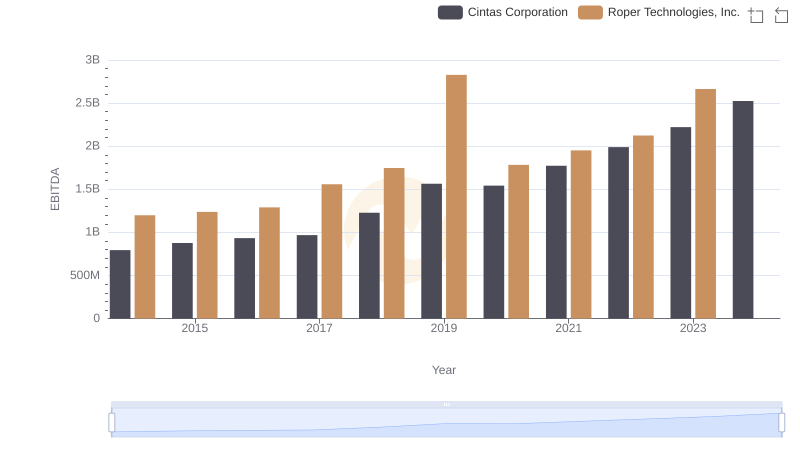
Comprehensive EBITDA Comparison: Cintas Corporation vs Roper Technologies, Inc.
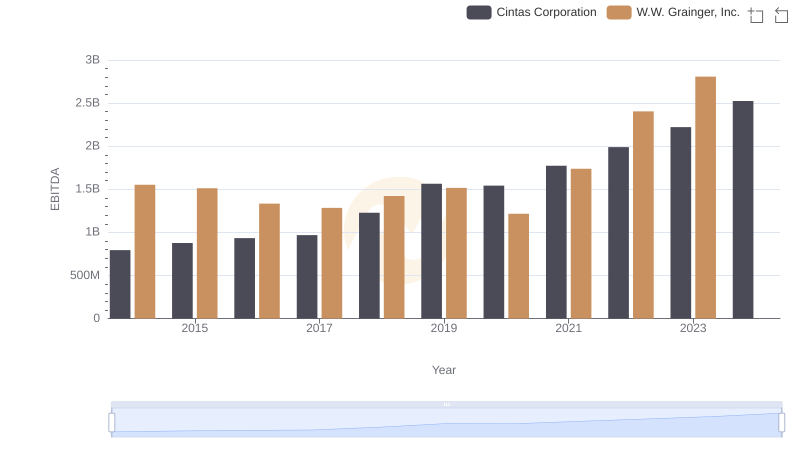
Cintas Corporation vs W.W. Grainger, Inc.: In-Depth EBITDA Performance Comparison
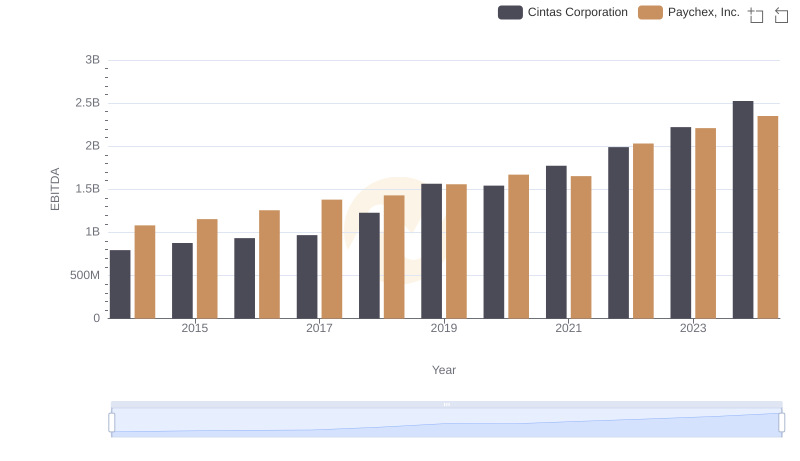
Comparative EBITDA Analysis: Cintas Corporation vs Paychex, Inc.
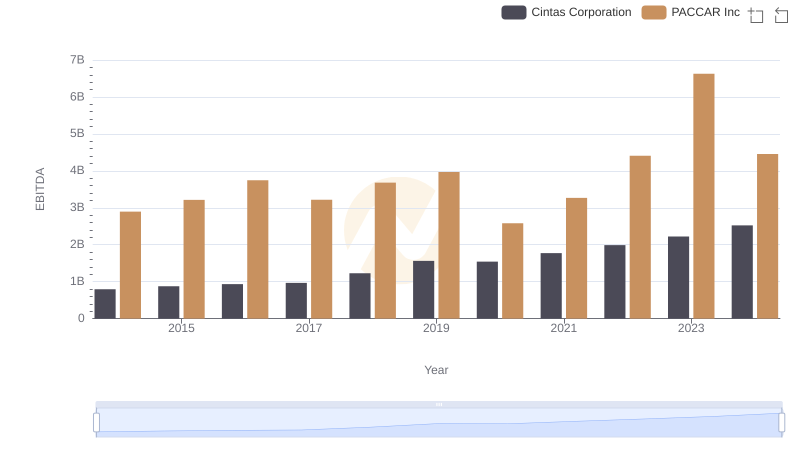
Cintas Corporation vs PACCAR Inc: In-Depth EBITDA Performance Comparison
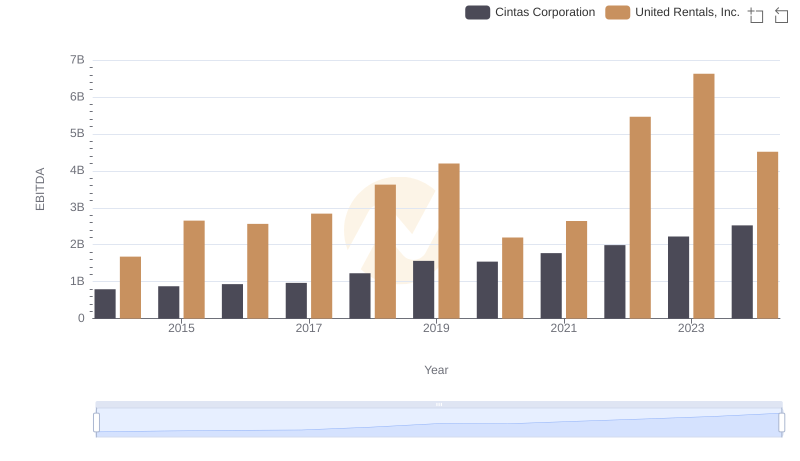
Comprehensive EBITDA Comparison: Cintas Corporation vs United Rentals, Inc.