| __timestamp | Cintas Corporation | Johnson Controls International plc |
|---|---|---|
| Wednesday, January 1, 2014 | 2637426000 | 36201000000 |
| Thursday, January 1, 2015 | 2555549000 | 30732000000 |
| Friday, January 1, 2016 | 2775588000 | 15183000000 |
| Sunday, January 1, 2017 | 2943086000 | 20833000000 |
| Monday, January 1, 2018 | 3568109000 | 22020000000 |
| Tuesday, January 1, 2019 | 3763715000 | 16275000000 |
| Wednesday, January 1, 2020 | 3851372000 | 14906000000 |
| Friday, January 1, 2021 | 3801689000 | 15609000000 |
| Saturday, January 1, 2022 | 4222213000 | 16956000000 |
| Sunday, January 1, 2023 | 4642401000 | 17822000000 |
| Monday, January 1, 2024 | 4910199000 | 14875000000 |
Infusing magic into the data realm
In the ever-evolving landscape of corporate finance, understanding the cost of revenue is crucial for assessing a company's operational efficiency. This analysis delves into the cost of revenue trends for Cintas Corporation and Johnson Controls International plc from 2014 to 2024.
Cintas Corporation has demonstrated a steady increase in its cost of revenue, growing by approximately 86% over the decade. This upward trajectory reflects the company's expanding operations and market reach. Notably, the cost of revenue surged from around $2.6 billion in 2014 to nearly $4.9 billion in 2024.
Conversely, Johnson Controls International plc experienced a more volatile pattern. Starting at a peak of $36.2 billion in 2014, the cost of revenue saw fluctuations, ultimately settling at about $14.9 billion in 2024. This represents a significant reduction, indicating strategic shifts or operational efficiencies.
These trends offer valuable insights into the financial strategies and market dynamics of these industry giants.
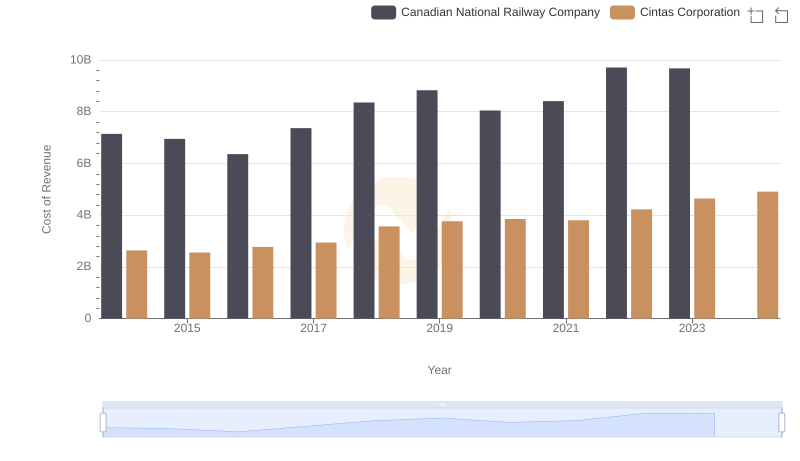
Cost Insights: Breaking Down Cintas Corporation and Canadian National Railway Company's Expenses
Cost of Revenue Comparison: Cintas Corporation vs Roper Technologies, Inc.
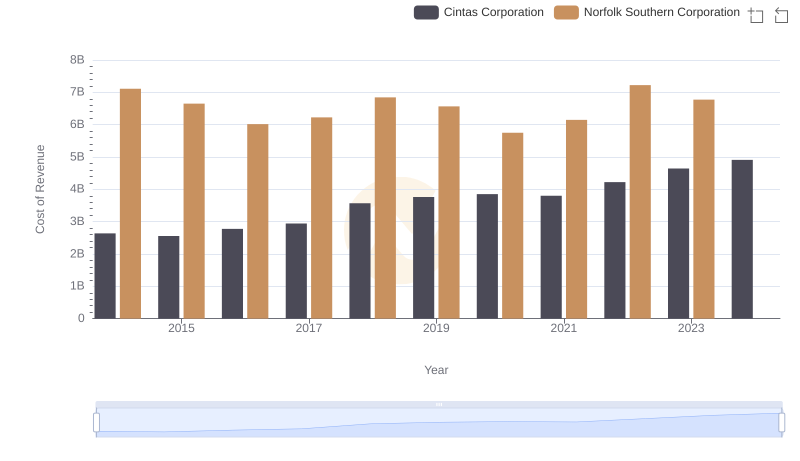
Cost of Revenue: Key Insights for Cintas Corporation and Norfolk Southern Corporation
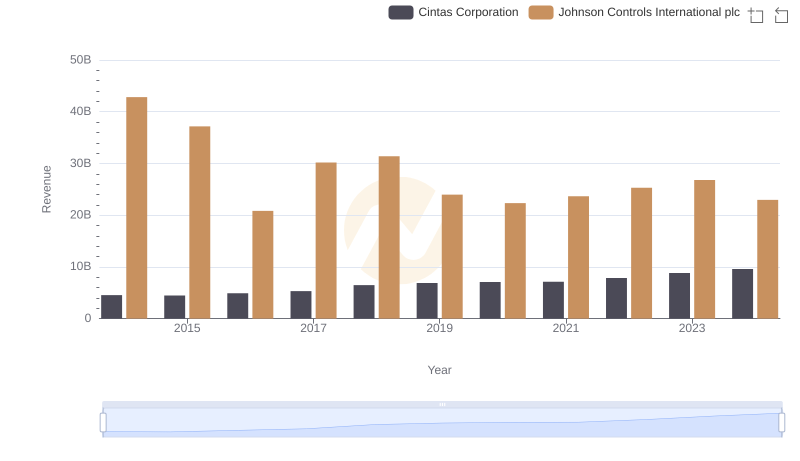
Comparing Revenue Performance: Cintas Corporation or Johnson Controls International plc?
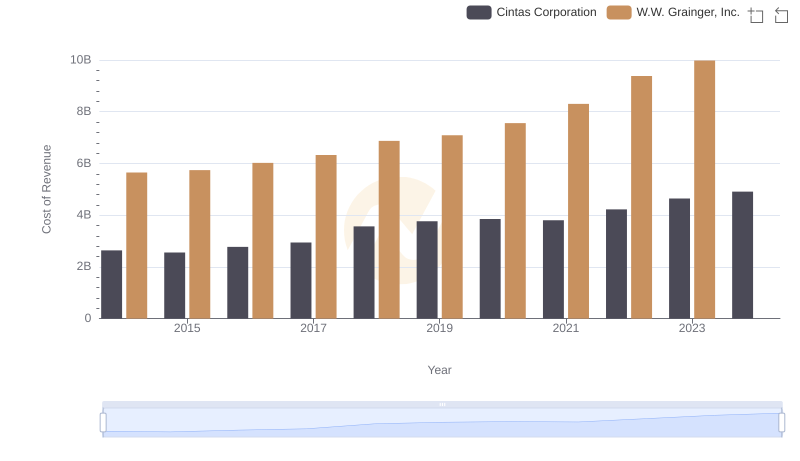
Cintas Corporation vs W.W. Grainger, Inc.: Efficiency in Cost of Revenue Explored
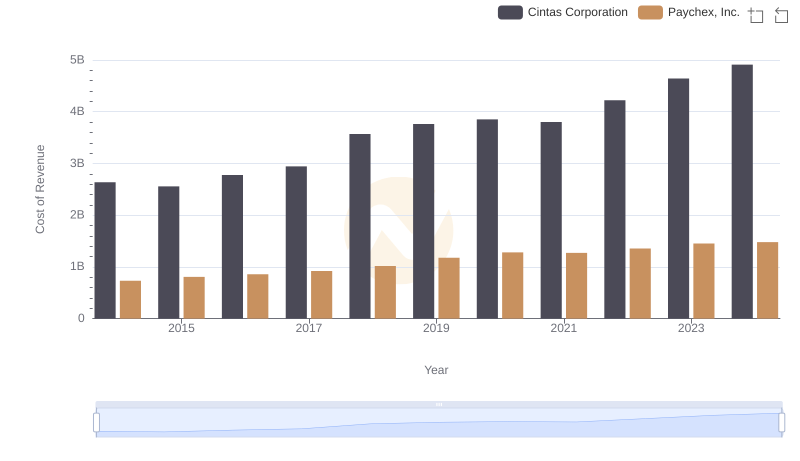
Cost Insights: Breaking Down Cintas Corporation and Paychex, Inc.'s Expenses
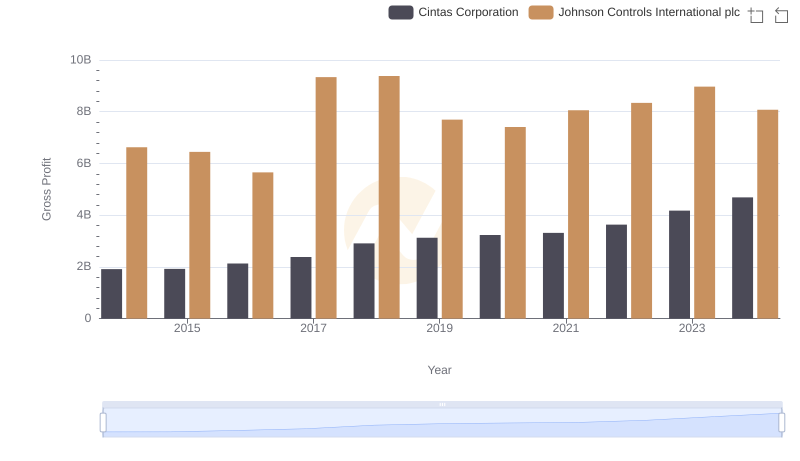
Gross Profit Trends Compared: Cintas Corporation vs Johnson Controls International plc
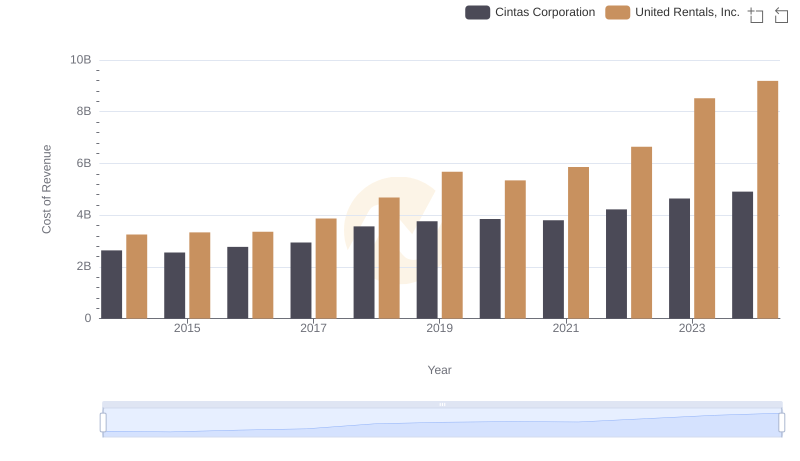
Comparing Cost of Revenue Efficiency: Cintas Corporation vs United Rentals, Inc.
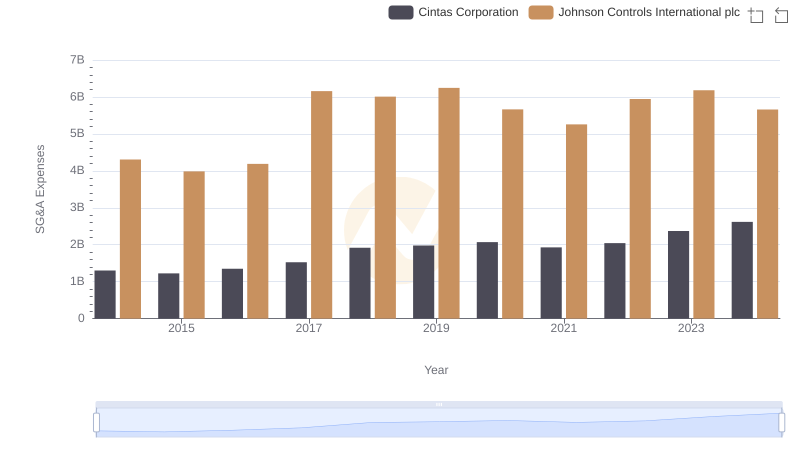
Cintas Corporation and Johnson Controls International plc: SG&A Spending Patterns Compared
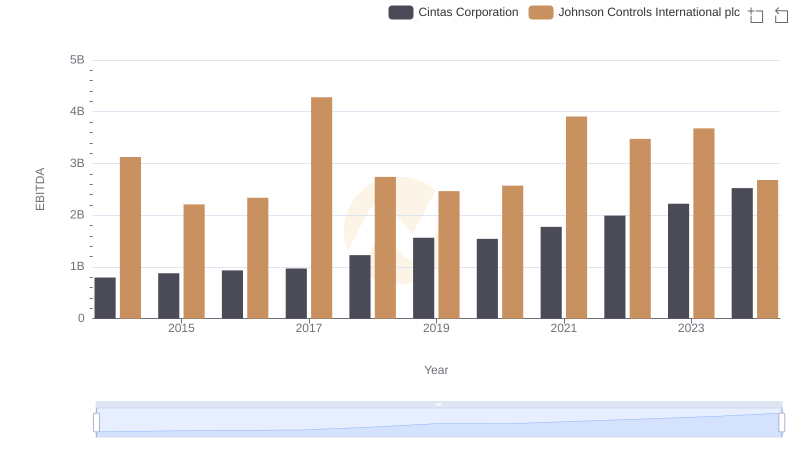
EBITDA Performance Review: Cintas Corporation vs Johnson Controls International plc