| __timestamp | Canadian National Railway Company | Cintas Corporation |
|---|---|---|
| Wednesday, January 1, 2014 | 4992000000 | 1914386000 |
| Thursday, January 1, 2015 | 5660000000 | 1921337000 |
| Friday, January 1, 2016 | 5675000000 | 2129870000 |
| Sunday, January 1, 2017 | 5675000000 | 2380295000 |
| Monday, January 1, 2018 | 5962000000 | 2908523000 |
| Tuesday, January 1, 2019 | 6085000000 | 3128588000 |
| Wednesday, January 1, 2020 | 5771000000 | 3233748000 |
| Friday, January 1, 2021 | 6069000000 | 3314651000 |
| Saturday, January 1, 2022 | 7396000000 | 3632246000 |
| Sunday, January 1, 2023 | 7151000000 | 4173368000 |
| Monday, January 1, 2024 | 4686416000 |
Infusing magic into the data realm
In the world of corporate finance, understanding the trajectory of gross profits is crucial for investors and analysts alike. This chart offers a fascinating glimpse into the financial journeys of Cintas Corporation and Canadian National Railway Company from 2014 to 2023.
Cintas Corporation has shown a remarkable upward trend, with gross profits increasing by approximately 118% over the decade. Starting at around $1.9 billion in 2014, Cintas reached an impressive $4.2 billion by 2023, showcasing its robust growth strategy and market adaptability.
Meanwhile, Canadian National Railway Company has maintained a steady performance, with gross profits peaking at $7.4 billion in 2022, a 48% increase from 2014. Despite a slight dip in 2023, the company remains a strong player in the transportation sector.
Both companies exemplify resilience and strategic growth, albeit with different trajectories. Missing data for 2024 suggests a need for updated insights to continue tracking these industry leaders.
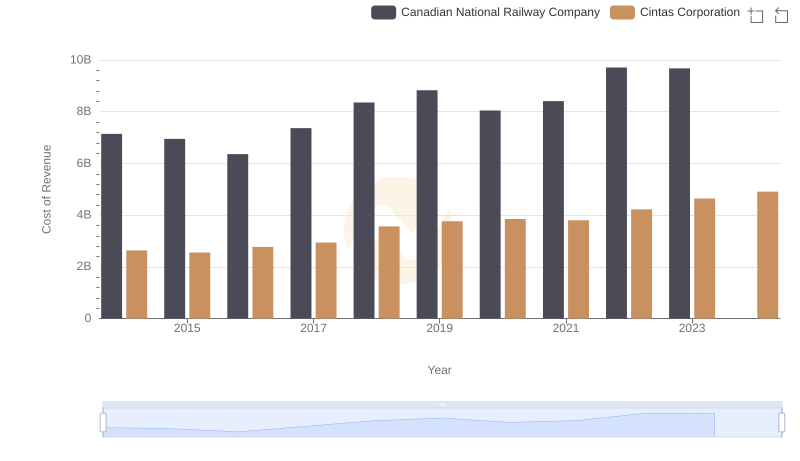
Cost Insights: Breaking Down Cintas Corporation and Canadian National Railway Company's Expenses
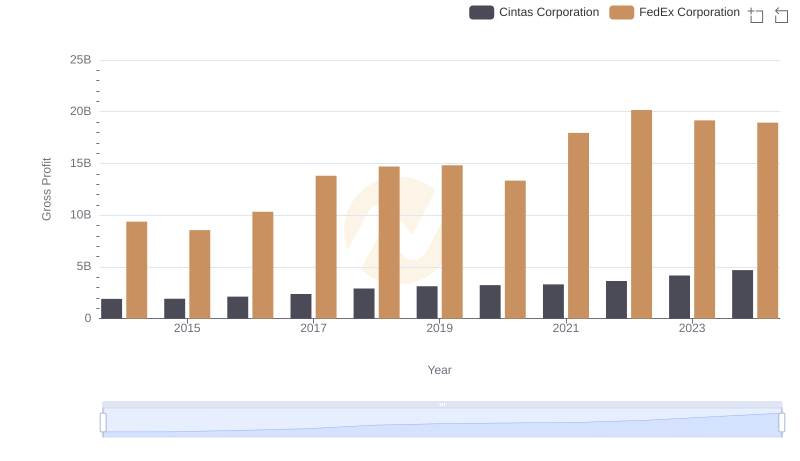
Gross Profit Comparison: Cintas Corporation and FedEx Corporation Trends
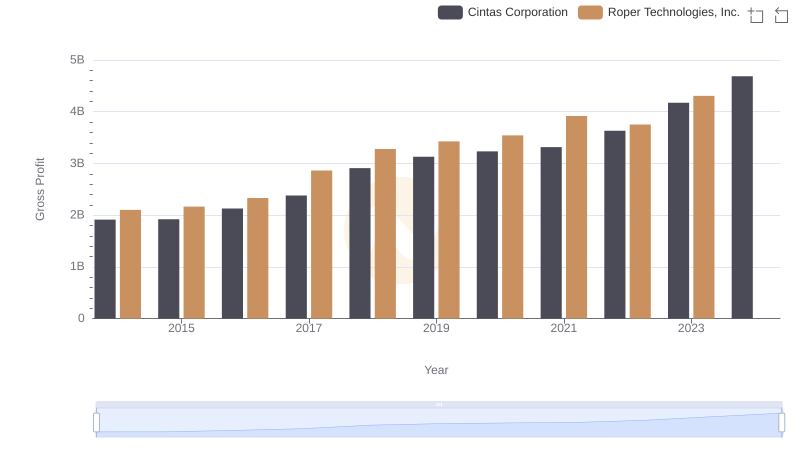
Key Insights on Gross Profit: Cintas Corporation vs Roper Technologies, Inc.
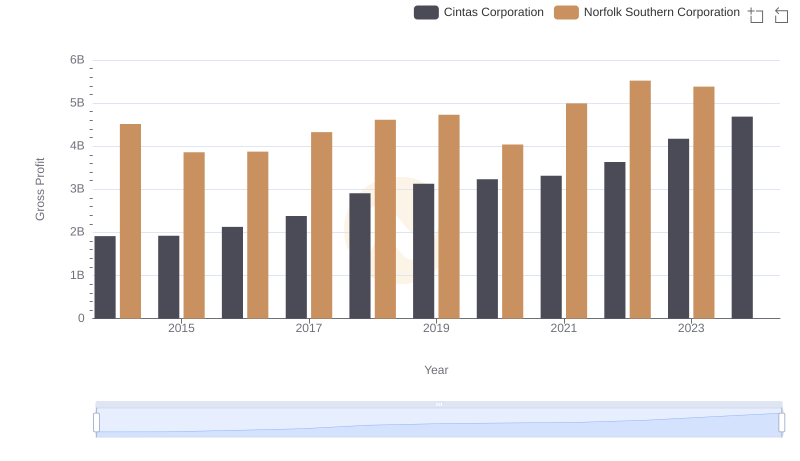
Gross Profit Analysis: Comparing Cintas Corporation and Norfolk Southern Corporation
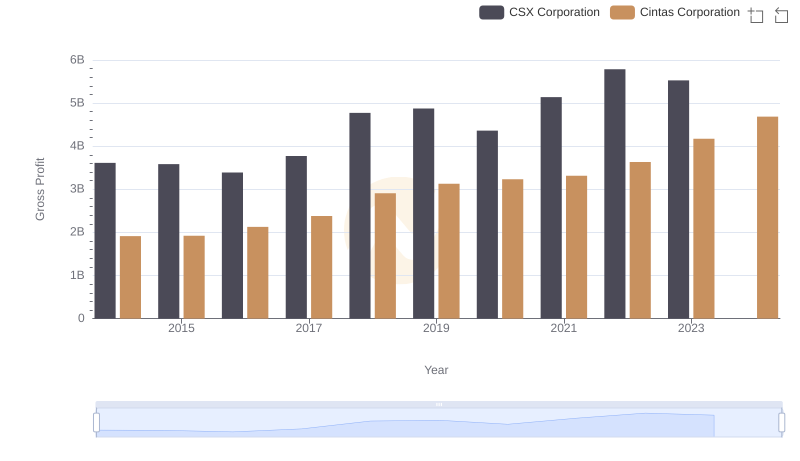
Cintas Corporation vs CSX Corporation: A Gross Profit Performance Breakdown
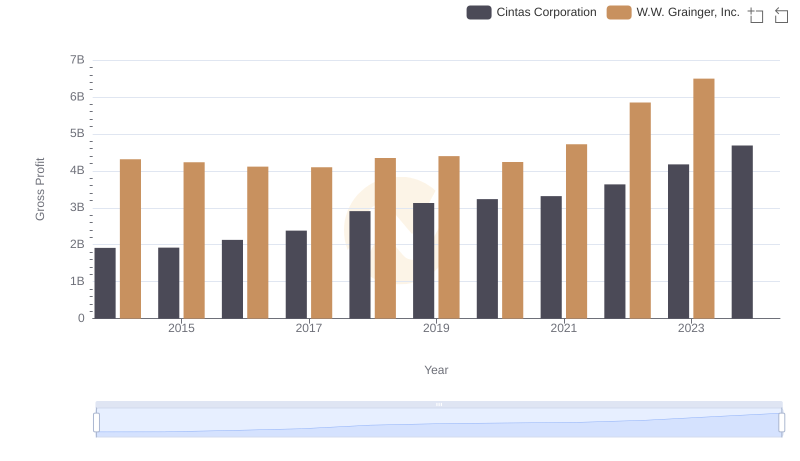
Who Generates Higher Gross Profit? Cintas Corporation or W.W. Grainger, Inc.
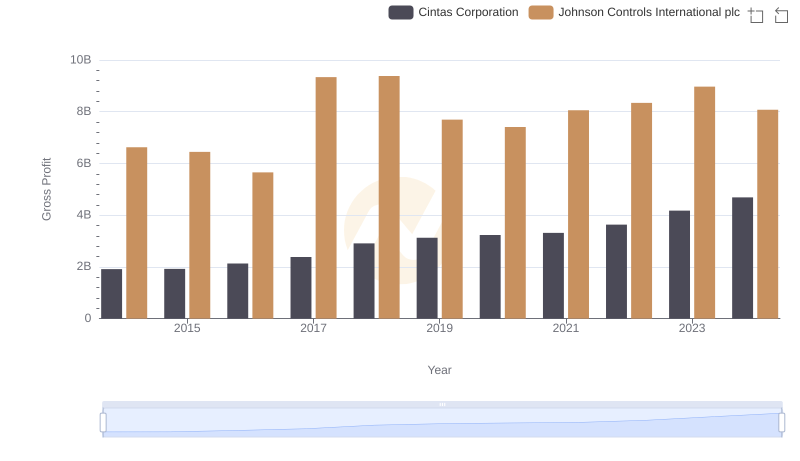
Gross Profit Trends Compared: Cintas Corporation vs Johnson Controls International plc
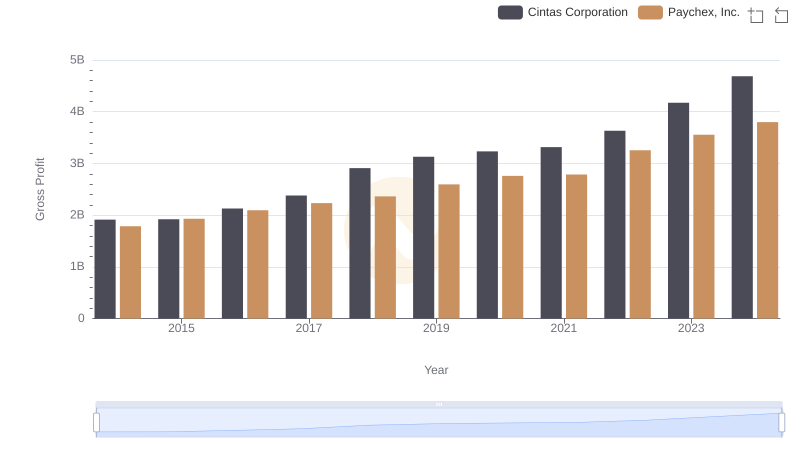
Key Insights on Gross Profit: Cintas Corporation vs Paychex, Inc.
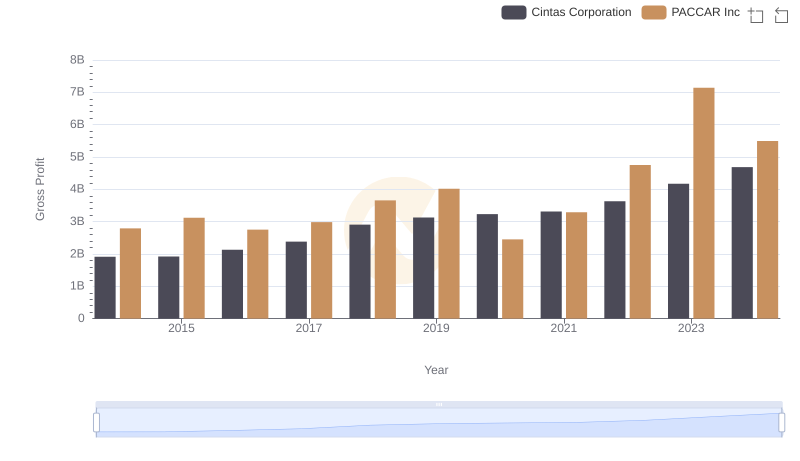
Gross Profit Comparison: Cintas Corporation and PACCAR Inc Trends
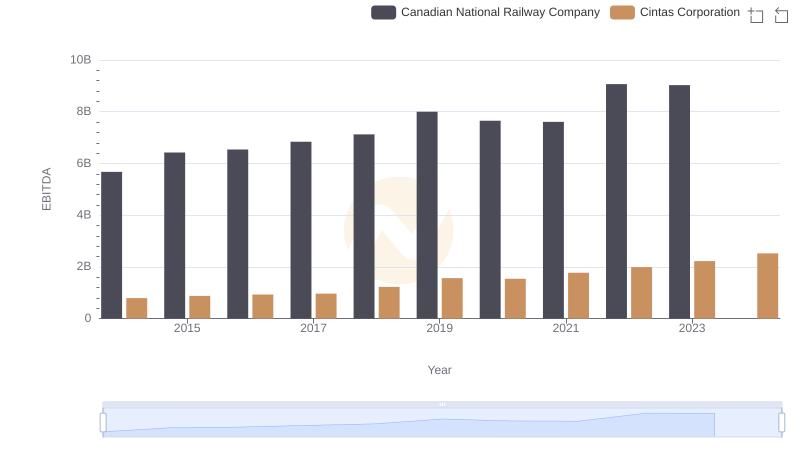
Professional EBITDA Benchmarking: Cintas Corporation vs Canadian National Railway Company
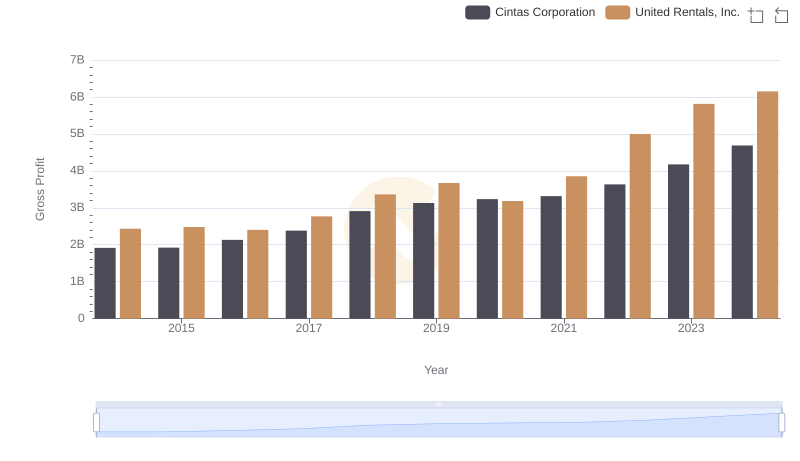
Gross Profit Analysis: Comparing Cintas Corporation and United Rentals, Inc.