| __timestamp | Cintas Corporation | Johnson Controls International plc |
|---|---|---|
| Wednesday, January 1, 2014 | 4551812000 | 42828000000 |
| Thursday, January 1, 2015 | 4476886000 | 37179000000 |
| Friday, January 1, 2016 | 4905458000 | 20837000000 |
| Sunday, January 1, 2017 | 5323381000 | 30172000000 |
| Monday, January 1, 2018 | 6476632000 | 31400000000 |
| Tuesday, January 1, 2019 | 6892303000 | 23968000000 |
| Wednesday, January 1, 2020 | 7085120000 | 22317000000 |
| Friday, January 1, 2021 | 7116340000 | 23668000000 |
| Saturday, January 1, 2022 | 7854459000 | 25299000000 |
| Sunday, January 1, 2023 | 8815769000 | 26793000000 |
| Monday, January 1, 2024 | 9596615000 | 22952000000 |
Infusing magic into the data realm
In the ever-evolving landscape of corporate revenue, Cintas Corporation and Johnson Controls International plc stand as titans in their respective industries. Over the past decade, from 2014 to 2024, these companies have showcased distinct revenue trajectories. Cintas Corporation, a leader in specialized services, has seen its revenue grow by approximately 111%, from $4.6 billion in 2014 to an impressive $9.6 billion in 2024. This growth reflects a robust annual increase, highlighting Cintas's strategic market positioning and operational efficiency.
Conversely, Johnson Controls International, a global leader in building technologies, experienced a more fluctuating revenue pattern. Starting at $42.8 billion in 2014, their revenue saw a decline, stabilizing around $22.9 billion in 2024. This shift underscores the challenges faced in the building technologies sector, including market saturation and evolving customer demands. As these giants continue to navigate their paths, their revenue performance offers valuable insights into industry trends and economic resilience.
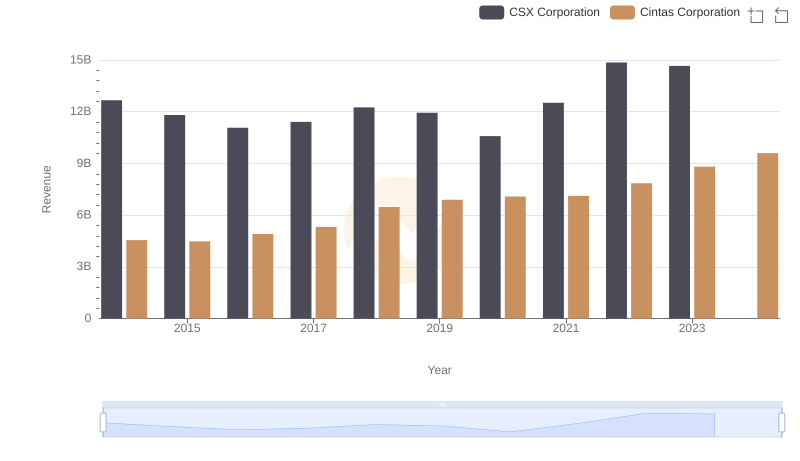
Revenue Insights: Cintas Corporation and CSX Corporation Performance Compared
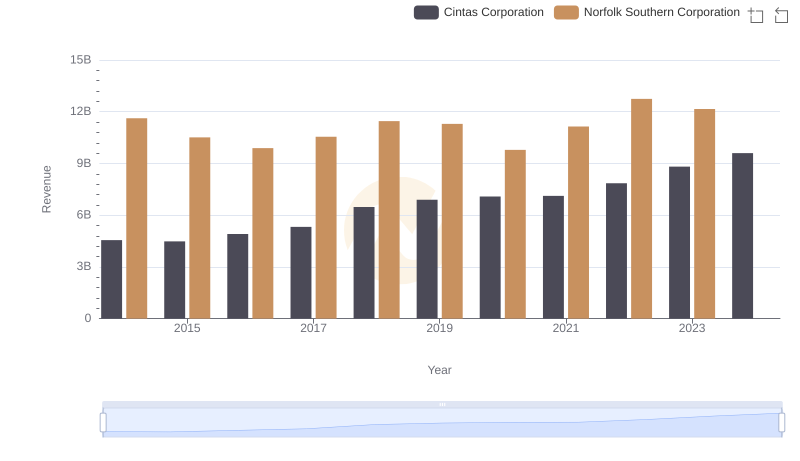
Cintas Corporation or Norfolk Southern Corporation: Who Leads in Yearly Revenue?
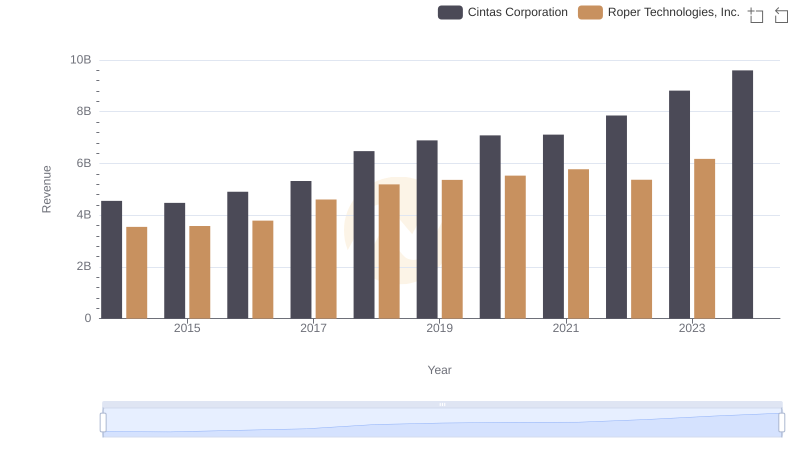
Comparing Revenue Performance: Cintas Corporation or Roper Technologies, Inc.?
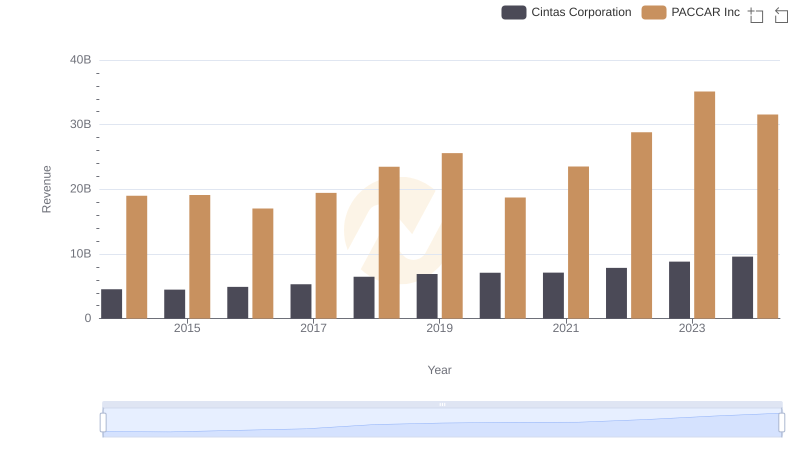
Who Generates More Revenue? Cintas Corporation or PACCAR Inc
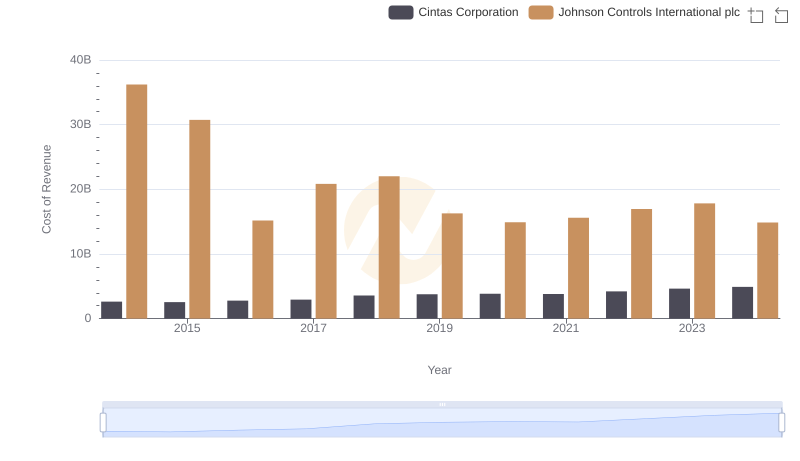
Cost of Revenue: Key Insights for Cintas Corporation and Johnson Controls International plc
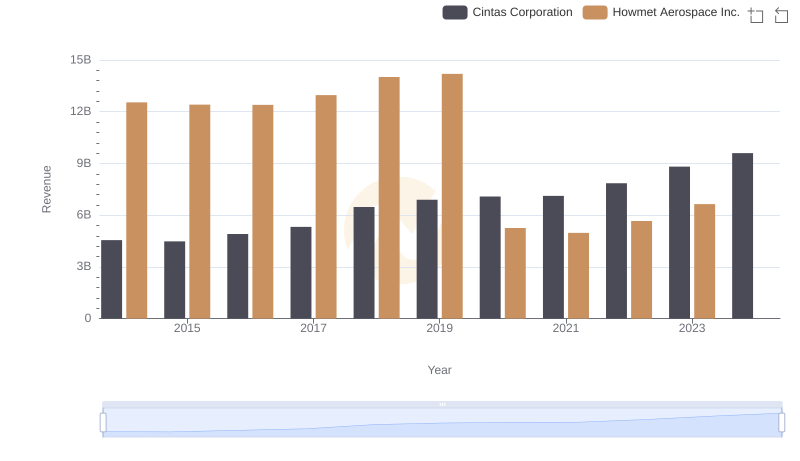
Cintas Corporation vs Howmet Aerospace Inc.: Examining Key Revenue Metrics
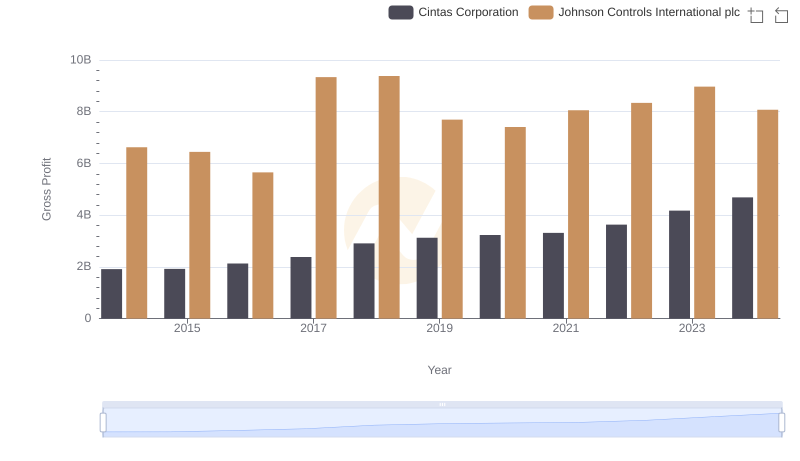
Gross Profit Trends Compared: Cintas Corporation vs Johnson Controls International plc
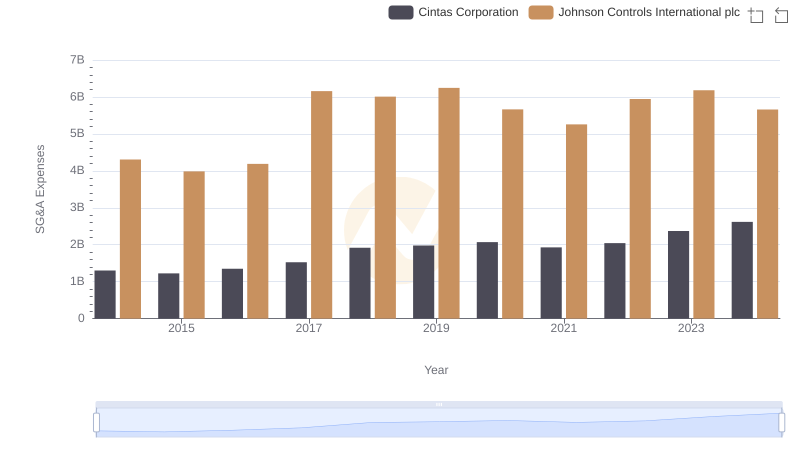
Cintas Corporation and Johnson Controls International plc: SG&A Spending Patterns Compared
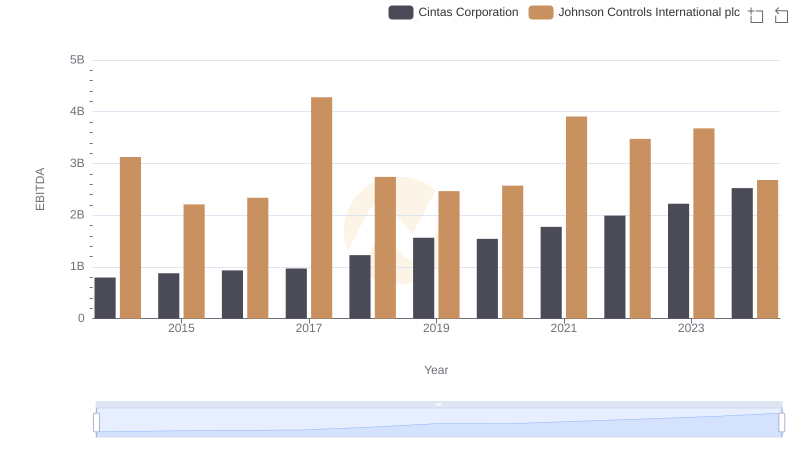
EBITDA Performance Review: Cintas Corporation vs Johnson Controls International plc