| __timestamp | Cintas Corporation | Cummins Inc. |
|---|---|---|
| Wednesday, January 1, 2014 | 1914386000 | 4861000000 |
| Thursday, January 1, 2015 | 1921337000 | 4947000000 |
| Friday, January 1, 2016 | 2129870000 | 4452000000 |
| Sunday, January 1, 2017 | 2380295000 | 5090000000 |
| Monday, January 1, 2018 | 2908523000 | 5737000000 |
| Tuesday, January 1, 2019 | 3128588000 | 5980000000 |
| Wednesday, January 1, 2020 | 3233748000 | 4894000000 |
| Friday, January 1, 2021 | 3314651000 | 5695000000 |
| Saturday, January 1, 2022 | 3632246000 | 6719000000 |
| Sunday, January 1, 2023 | 4173368000 | 8249000000 |
| Monday, January 1, 2024 | 4686416000 | 8439000000 |
Igniting the spark of knowledge
In the competitive landscape of American industry, Cintas Corporation and Cummins Inc. have showcased remarkable growth in gross profit over the past decade. From 2014 to 2023, Cintas Corporation's gross profit surged by approximately 145%, reflecting its robust expansion in the uniform and facility services sector. Meanwhile, Cummins Inc., a leader in power solutions, experienced a 70% increase in gross profit, underscoring its resilience and innovation in the face of global challenges.
Cintas Corporation's consistent upward trajectory, peaking at an impressive $4.17 billion in 2023, highlights its strategic market positioning. Cummins Inc. reached a high of $8.25 billion in the same year, despite a dip in 2020, demonstrating its ability to rebound and thrive. Notably, data for 2024 is incomplete, leaving room for speculation on future trends.
These insights offer a glimpse into the dynamic shifts within these industries, providing valuable context for investors and analysts alike.
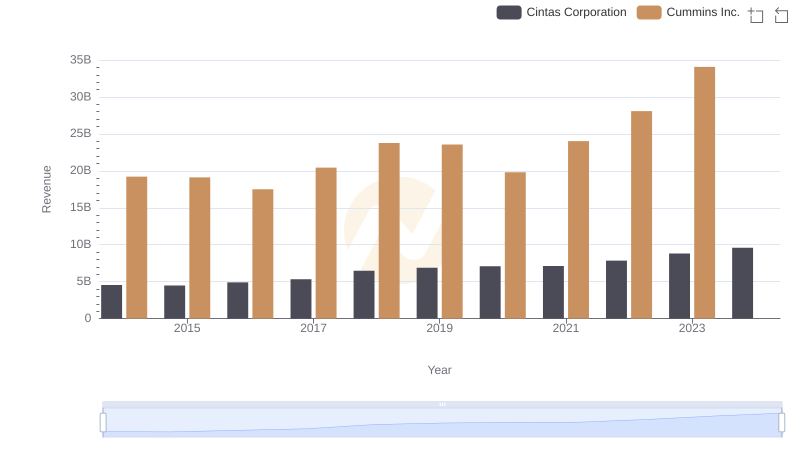
Comparing Revenue Performance: Cintas Corporation or Cummins Inc.?
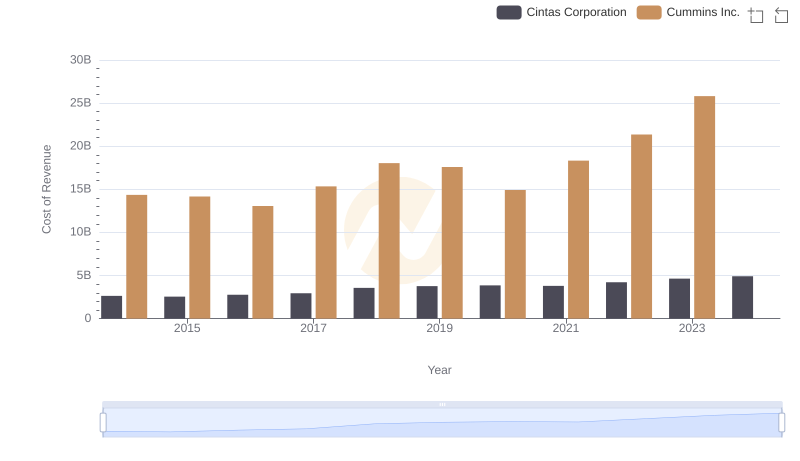
Cost Insights: Breaking Down Cintas Corporation and Cummins Inc.'s Expenses
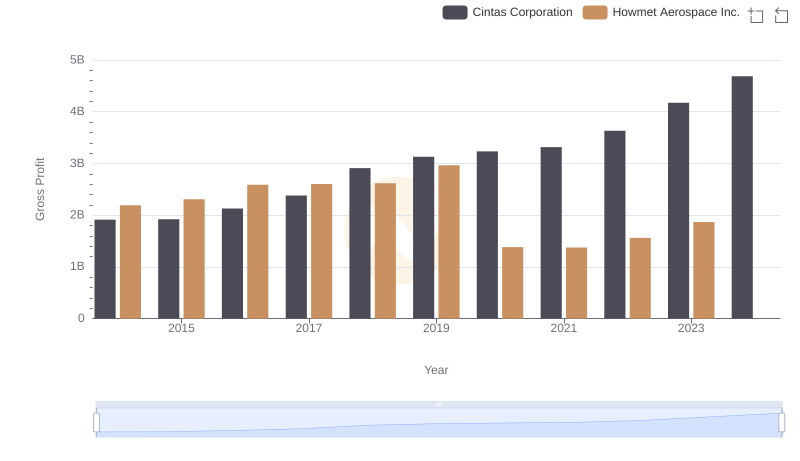
Who Generates Higher Gross Profit? Cintas Corporation or Howmet Aerospace Inc.
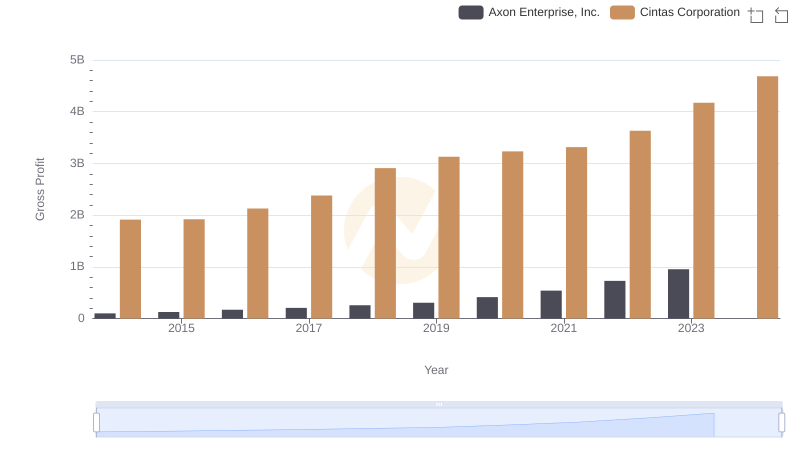
Key Insights on Gross Profit: Cintas Corporation vs Axon Enterprise, Inc.
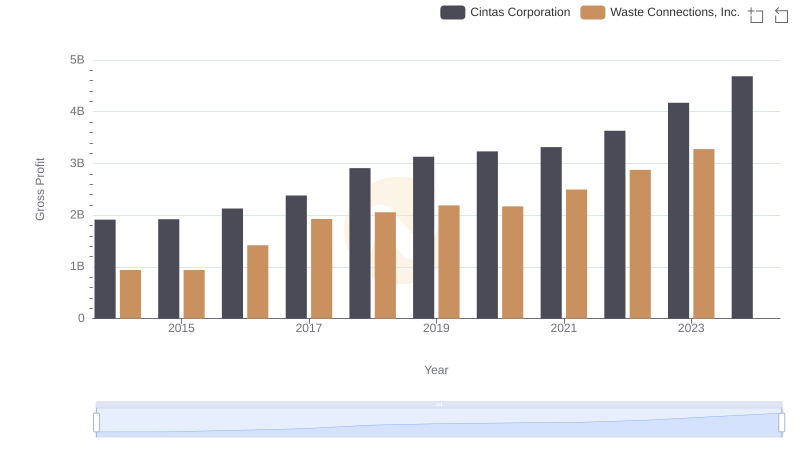
Key Insights on Gross Profit: Cintas Corporation vs Waste Connections, Inc.
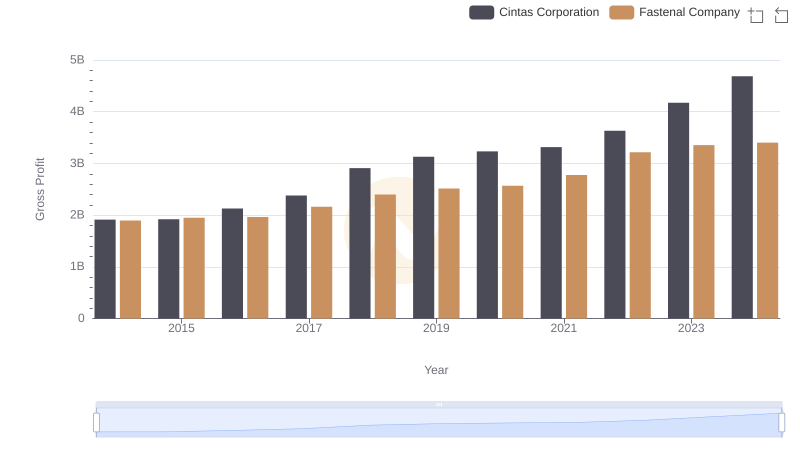
Key Insights on Gross Profit: Cintas Corporation vs Fastenal Company
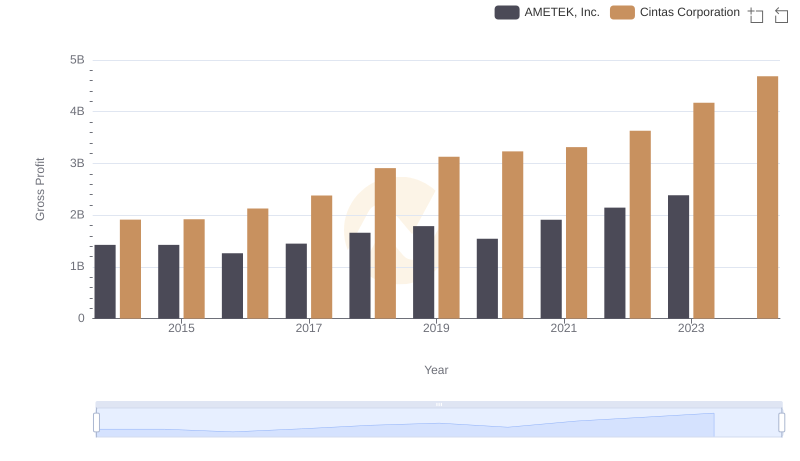
Cintas Corporation vs AMETEK, Inc.: A Gross Profit Performance Breakdown
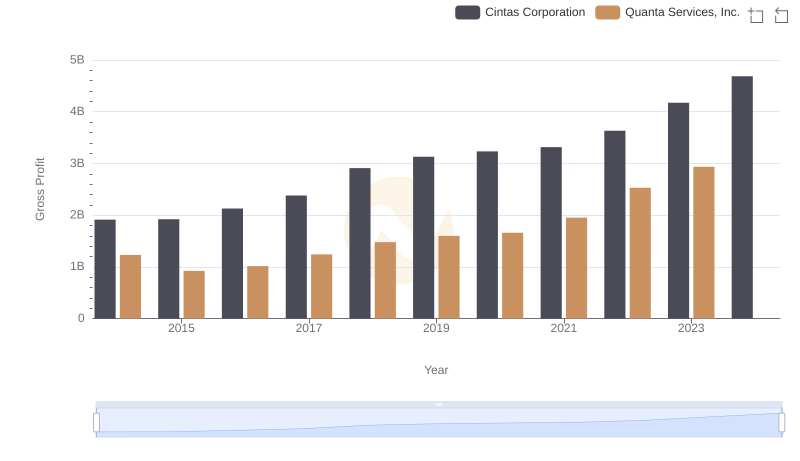
Gross Profit Comparison: Cintas Corporation and Quanta Services, Inc. Trends
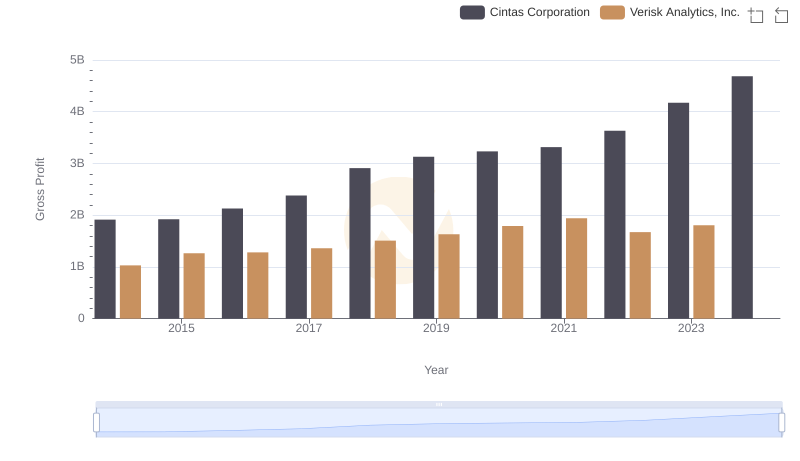
Cintas Corporation and Verisk Analytics, Inc.: A Detailed Gross Profit Analysis
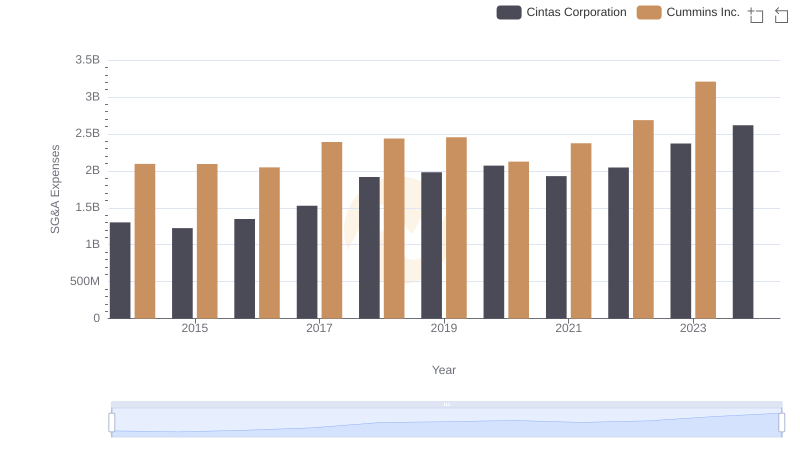
Breaking Down SG&A Expenses: Cintas Corporation vs Cummins Inc.
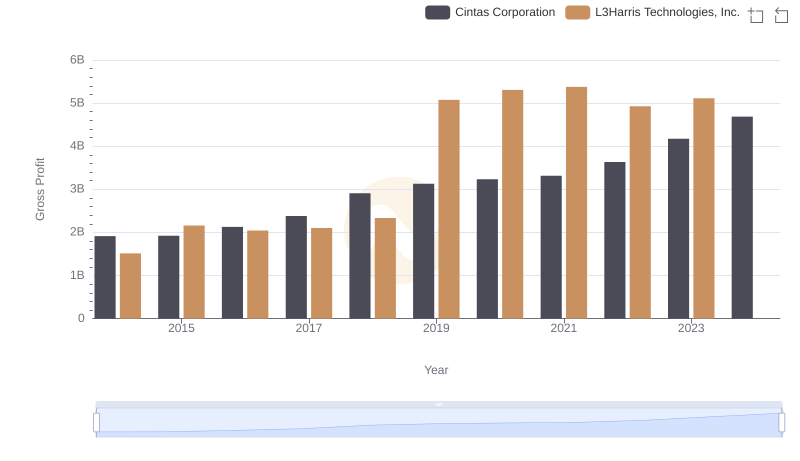
Gross Profit Trends Compared: Cintas Corporation vs L3Harris Technologies, Inc.
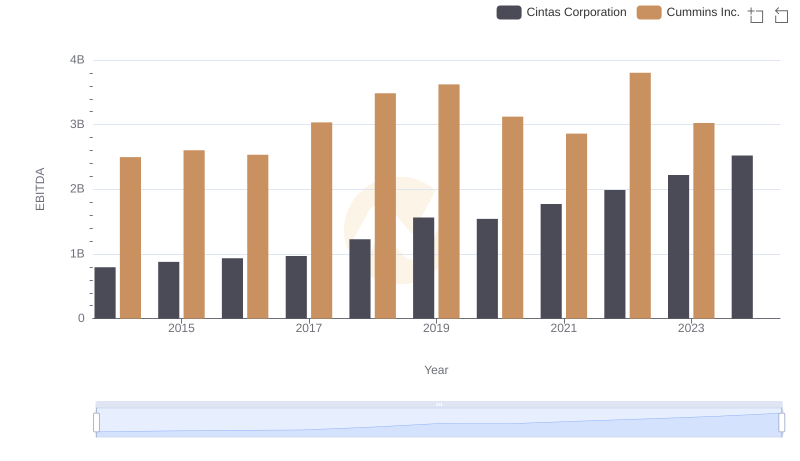
EBITDA Analysis: Evaluating Cintas Corporation Against Cummins Inc.