| __timestamp | Cintas Corporation | Quanta Services, Inc. |
|---|---|---|
| Wednesday, January 1, 2014 | 1914386000 | 1233520000 |
| Thursday, January 1, 2015 | 1921337000 | 923665000 |
| Friday, January 1, 2016 | 2129870000 | 1013800000 |
| Sunday, January 1, 2017 | 2380295000 | 1241860000 |
| Monday, January 1, 2018 | 2908523000 | 1479964000 |
| Tuesday, January 1, 2019 | 3128588000 | 1600252000 |
| Wednesday, January 1, 2020 | 3233748000 | 1660847000 |
| Friday, January 1, 2021 | 3314651000 | 1953259000 |
| Saturday, January 1, 2022 | 3632246000 | 2529155000 |
| Sunday, January 1, 2023 | 4173368000 | 2937086000 |
| Monday, January 1, 2024 | 4686416000 |
Cracking the code
In the ever-evolving landscape of corporate America, Cintas Corporation and Quanta Services, Inc. have emerged as formidable players. Over the past decade, Cintas has demonstrated a robust growth trajectory, with its gross profit surging by approximately 145% from 2014 to 2023. This impressive growth reflects Cintas's strategic expansions and operational efficiencies.
Quanta Services, Inc., while trailing behind Cintas, has also shown commendable progress. From 2014 to 2023, Quanta's gross profit increased by nearly 138%, underscoring its resilience and adaptability in a competitive market. Notably, Quanta's gross profit data for 2024 is missing, leaving room for speculation about its future performance.
As we look to the future, these trends highlight the dynamic nature of the industry and the potential for continued growth and innovation. Investors and industry watchers alike will be keenly observing how these companies navigate the challenges and opportunities ahead.
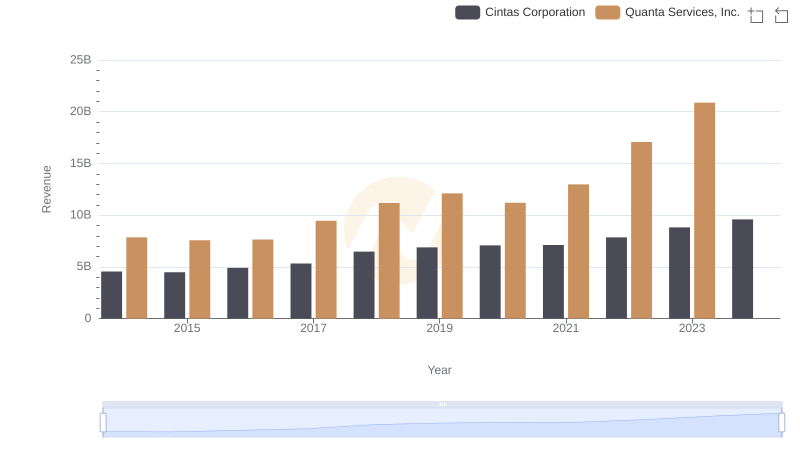
Who Generates More Revenue? Cintas Corporation or Quanta Services, Inc.
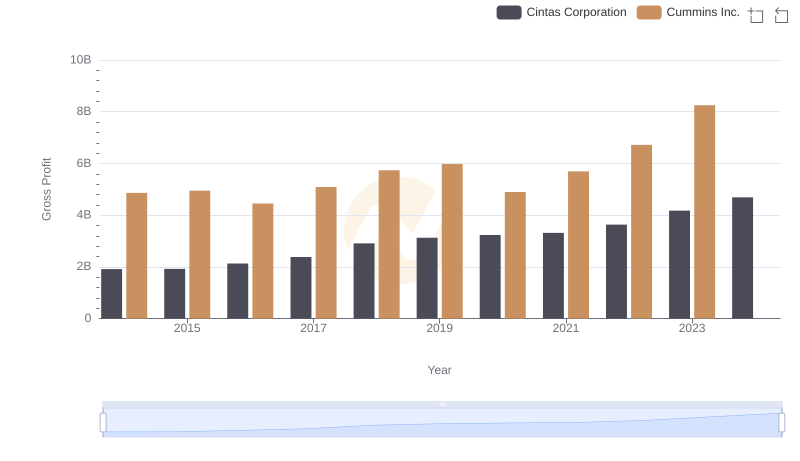
Gross Profit Trends Compared: Cintas Corporation vs Cummins Inc.
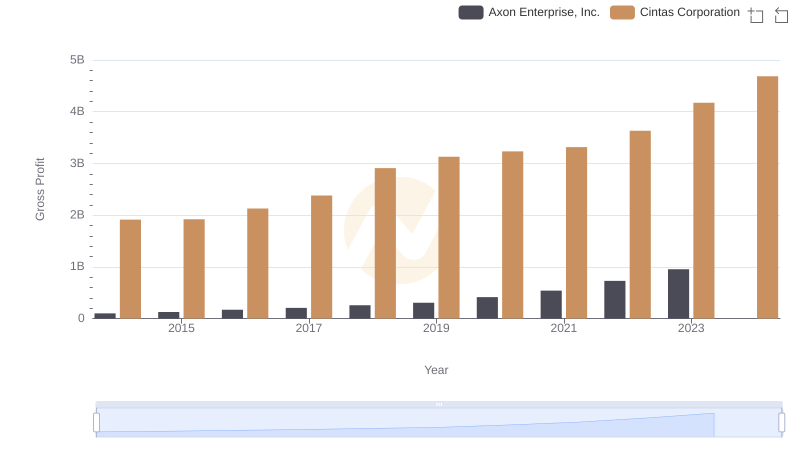
Key Insights on Gross Profit: Cintas Corporation vs Axon Enterprise, Inc.
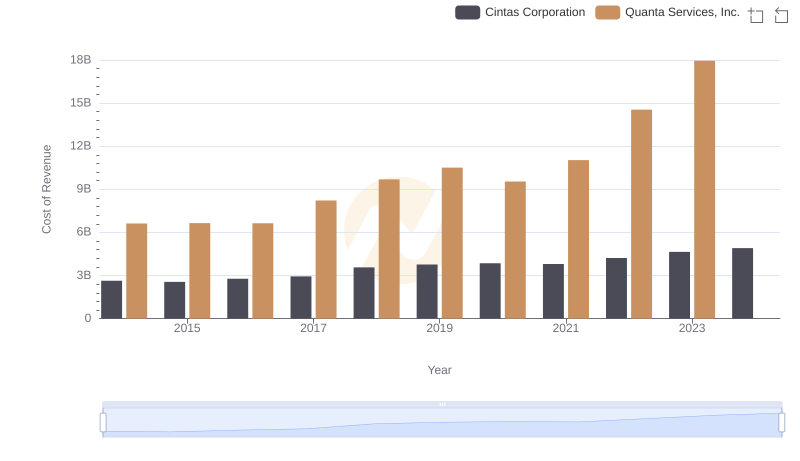
Analyzing Cost of Revenue: Cintas Corporation and Quanta Services, Inc.
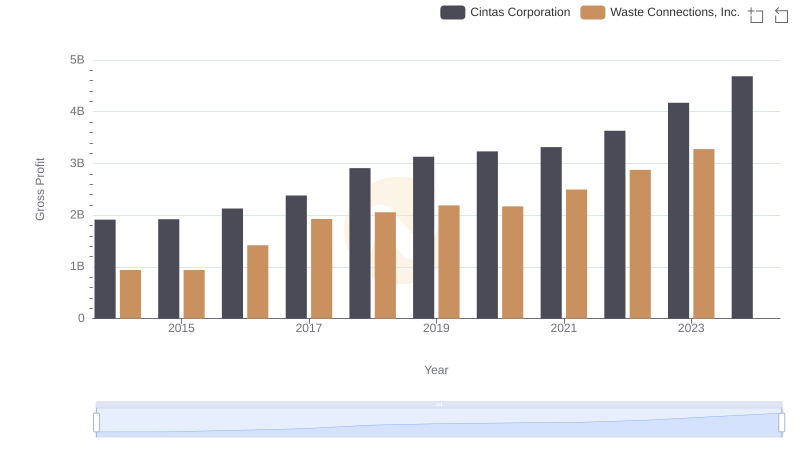
Key Insights on Gross Profit: Cintas Corporation vs Waste Connections, Inc.
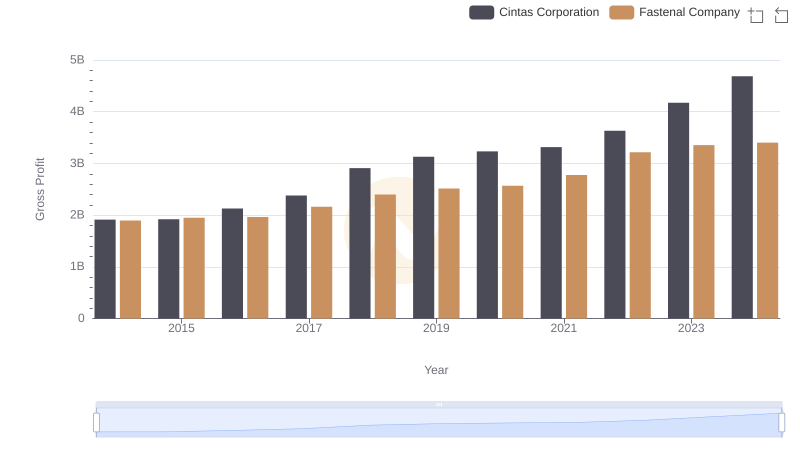
Key Insights on Gross Profit: Cintas Corporation vs Fastenal Company
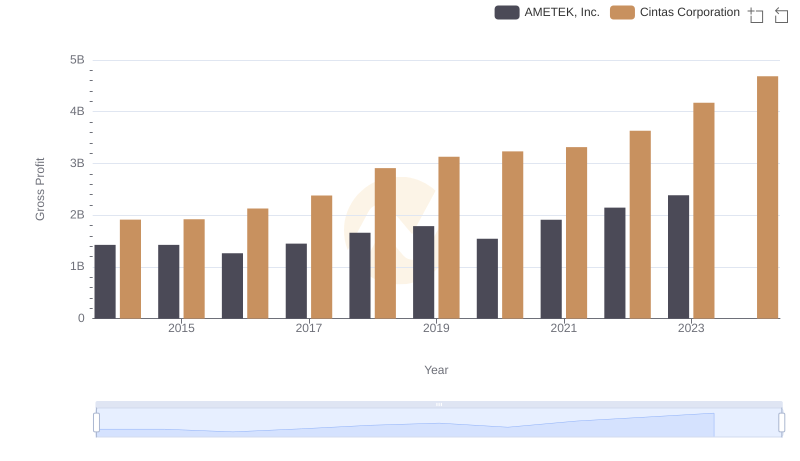
Cintas Corporation vs AMETEK, Inc.: A Gross Profit Performance Breakdown
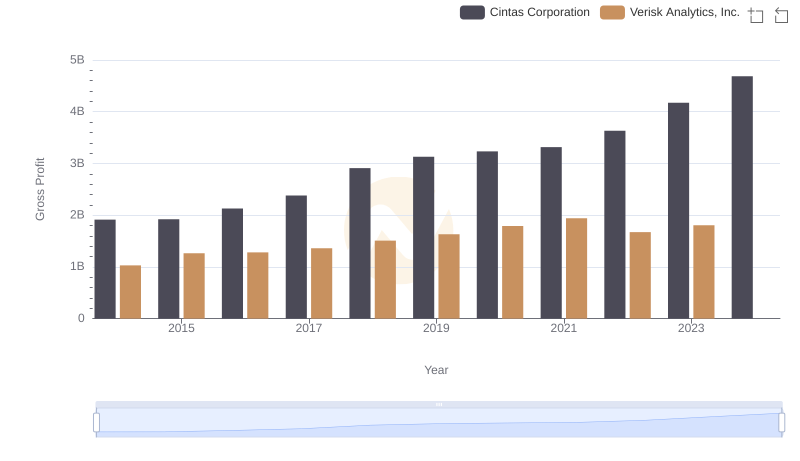
Cintas Corporation and Verisk Analytics, Inc.: A Detailed Gross Profit Analysis
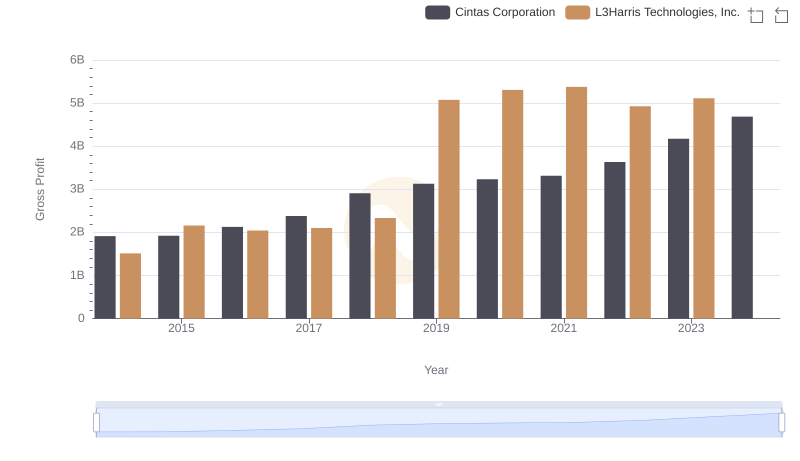
Gross Profit Trends Compared: Cintas Corporation vs L3Harris Technologies, Inc.
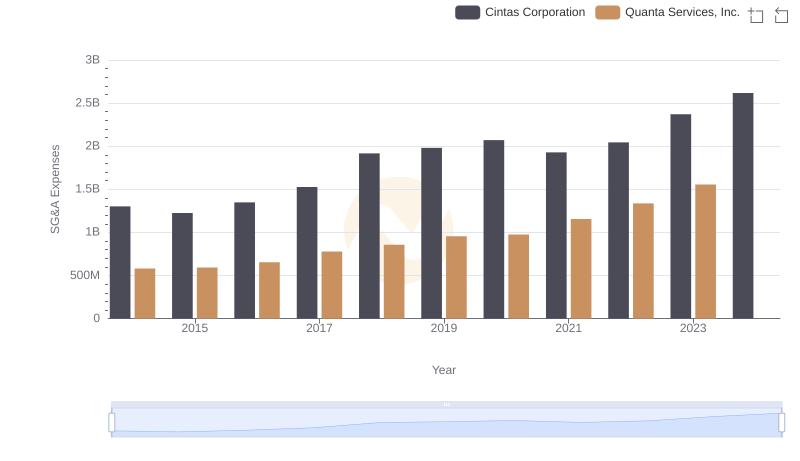
Who Optimizes SG&A Costs Better? Cintas Corporation or Quanta Services, Inc.
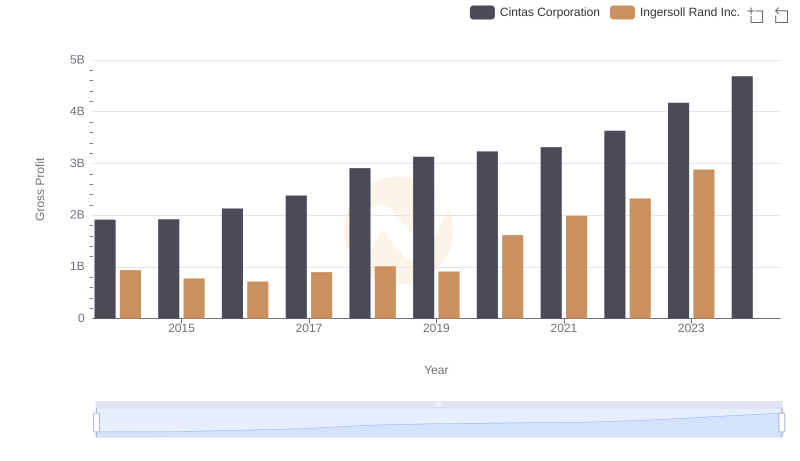
Gross Profit Trends Compared: Cintas Corporation vs Ingersoll Rand Inc.
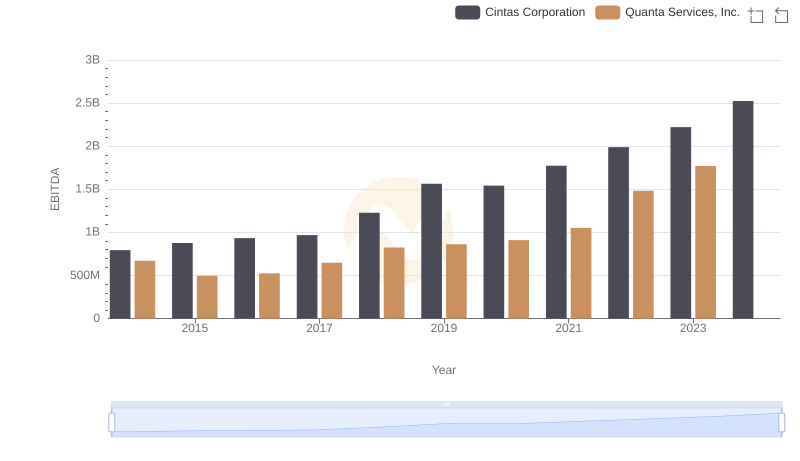
Comparative EBITDA Analysis: Cintas Corporation vs Quanta Services, Inc.