| __timestamp | Cintas Corporation | Cummins Inc. |
|---|---|---|
| Wednesday, January 1, 2014 | 4551812000 | 19221000000 |
| Thursday, January 1, 2015 | 4476886000 | 19110000000 |
| Friday, January 1, 2016 | 4905458000 | 17509000000 |
| Sunday, January 1, 2017 | 5323381000 | 20428000000 |
| Monday, January 1, 2018 | 6476632000 | 23771000000 |
| Tuesday, January 1, 2019 | 6892303000 | 23571000000 |
| Wednesday, January 1, 2020 | 7085120000 | 19811000000 |
| Friday, January 1, 2021 | 7116340000 | 24021000000 |
| Saturday, January 1, 2022 | 7854459000 | 28074000000 |
| Sunday, January 1, 2023 | 8815769000 | 34065000000 |
| Monday, January 1, 2024 | 9596615000 | 34102000000 |
Unleashing insights
In the ever-evolving landscape of American industry, Cintas Corporation and Cummins Inc. have emerged as formidable players. Over the past decade, from 2014 to 2023, these companies have demonstrated remarkable revenue trajectories, albeit with distinct patterns.
Cintas Corporation, a leader in corporate identity uniforms, has seen its revenue grow by approximately 111%, from $4.6 billion in 2014 to an impressive $9.6 billion in 2023. This consistent upward trend underscores Cintas's strategic expansion and market penetration.
Conversely, Cummins Inc., a powerhouse in engine manufacturing, experienced a more volatile revenue journey. Starting at $19.2 billion in 2014, Cummins reached a peak of $34.1 billion in 2023, marking a 77% increase. However, the data for 2024 remains elusive, leaving room for speculation on future performance.
This comparative analysis highlights the dynamic nature of revenue growth in diverse sectors, offering valuable insights for investors and industry enthusiasts alike.
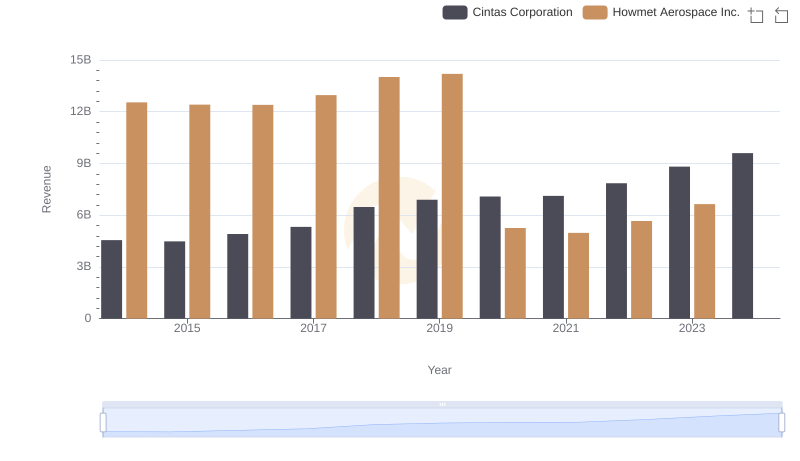
Cintas Corporation vs Howmet Aerospace Inc.: Examining Key Revenue Metrics
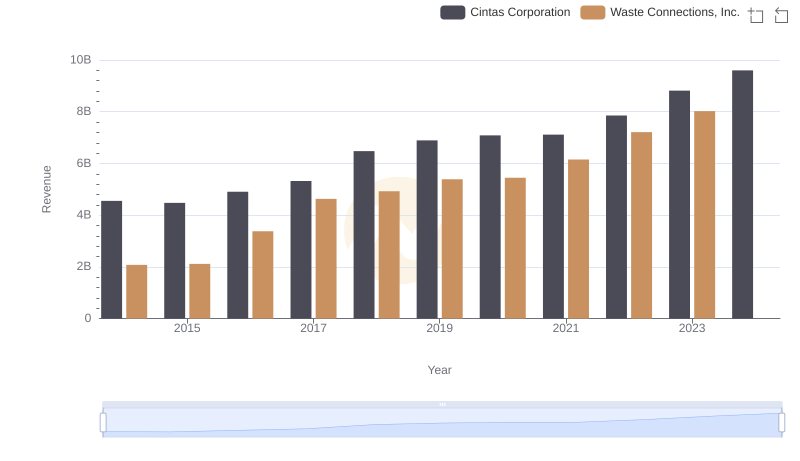
Cintas Corporation and Waste Connections, Inc.: A Comprehensive Revenue Analysis
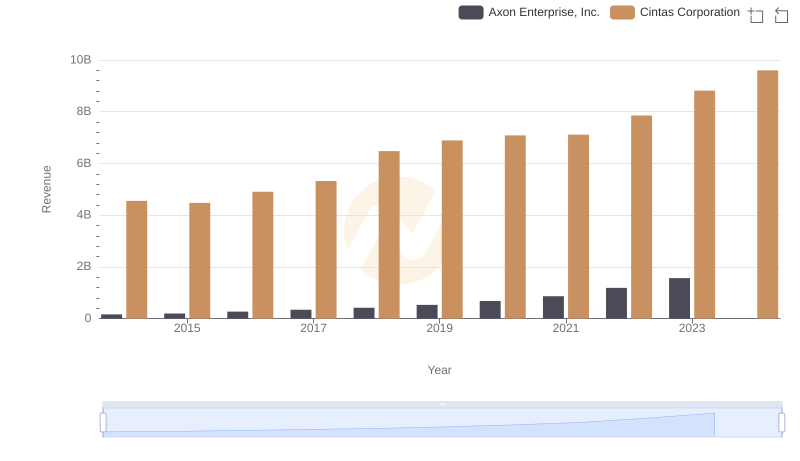
Cintas Corporation vs Axon Enterprise, Inc.: Annual Revenue Growth Compared
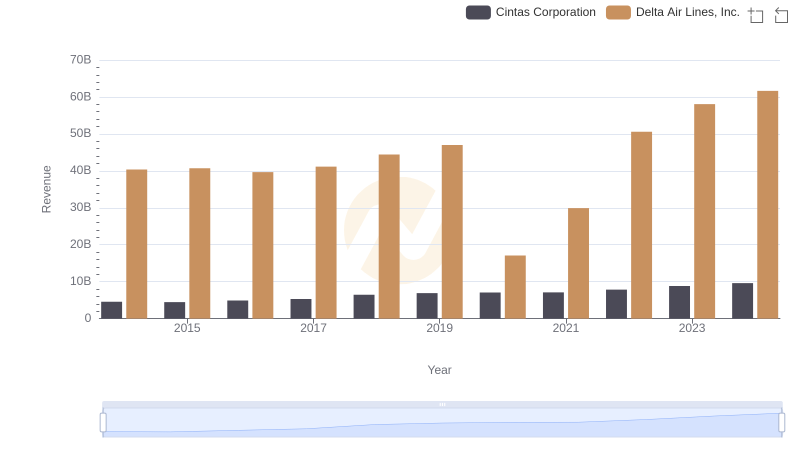
Who Generates More Revenue? Cintas Corporation or Delta Air Lines, Inc.
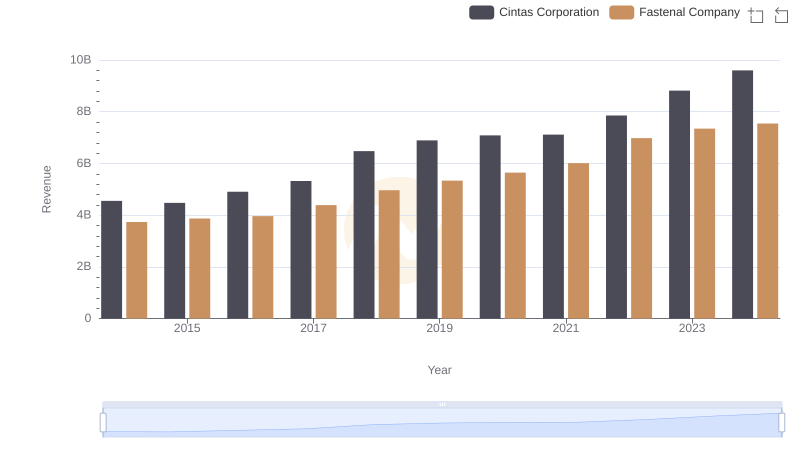
Cintas Corporation vs Fastenal Company: Examining Key Revenue Metrics
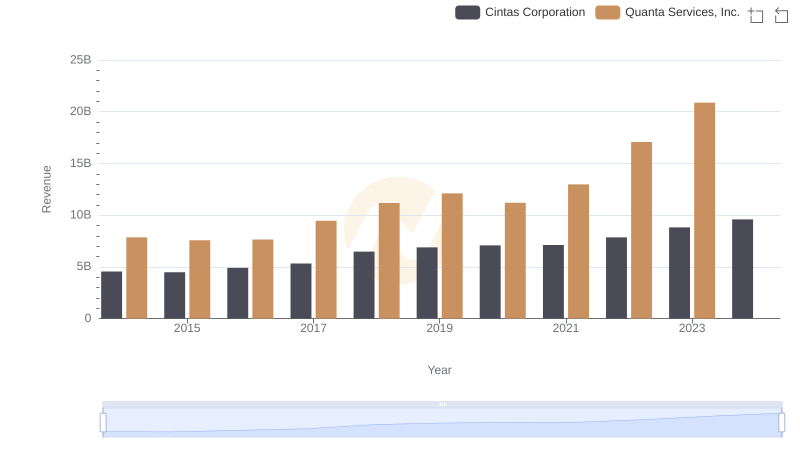
Who Generates More Revenue? Cintas Corporation or Quanta Services, Inc.
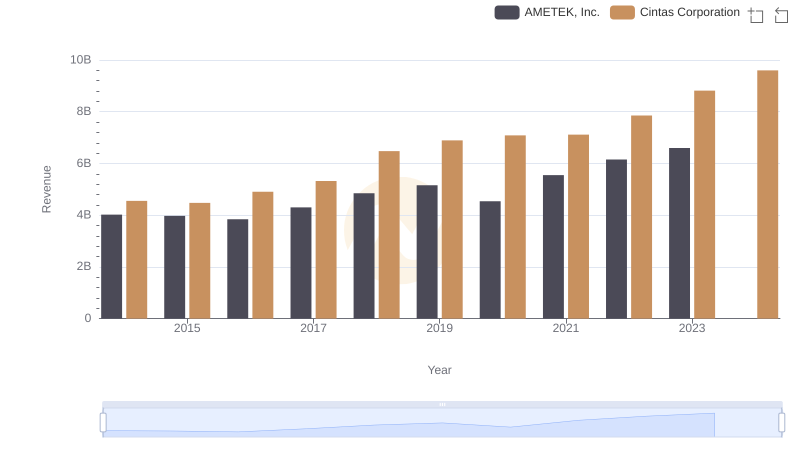
Cintas Corporation vs AMETEK, Inc.: Examining Key Revenue Metrics
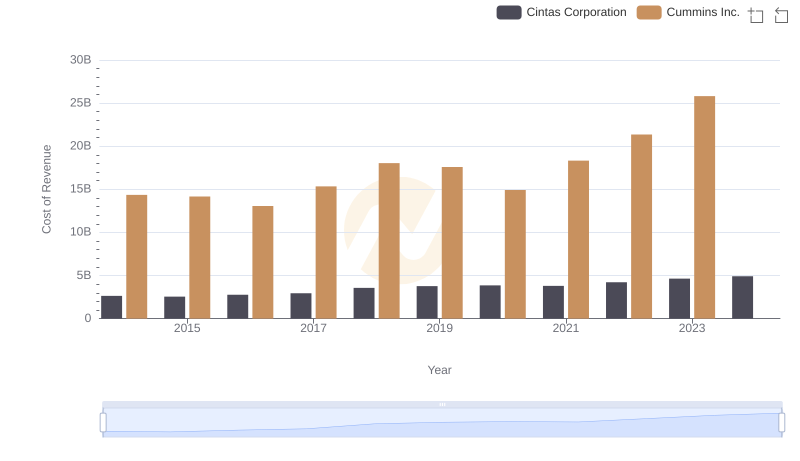
Cost Insights: Breaking Down Cintas Corporation and Cummins Inc.'s Expenses
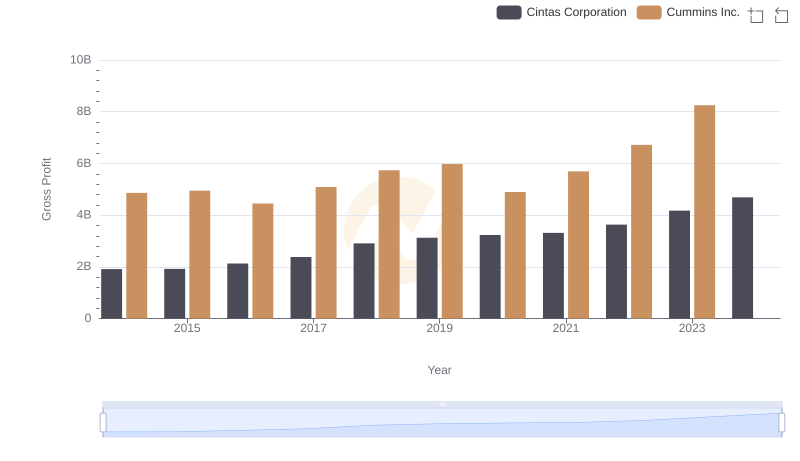
Gross Profit Trends Compared: Cintas Corporation vs Cummins Inc.
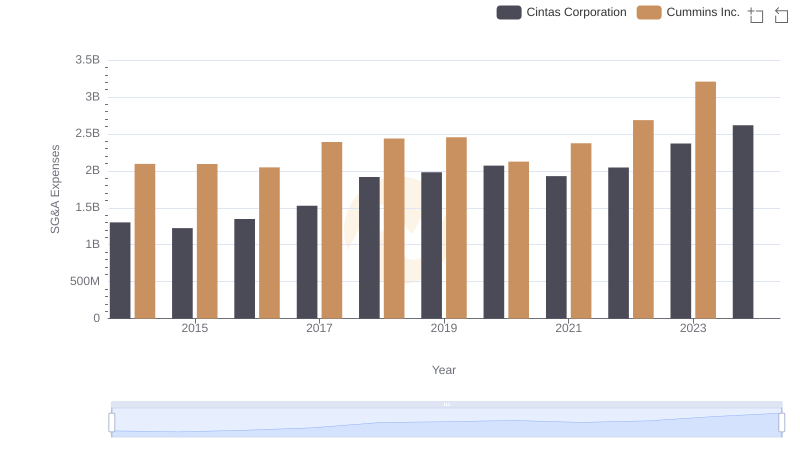
Breaking Down SG&A Expenses: Cintas Corporation vs Cummins Inc.
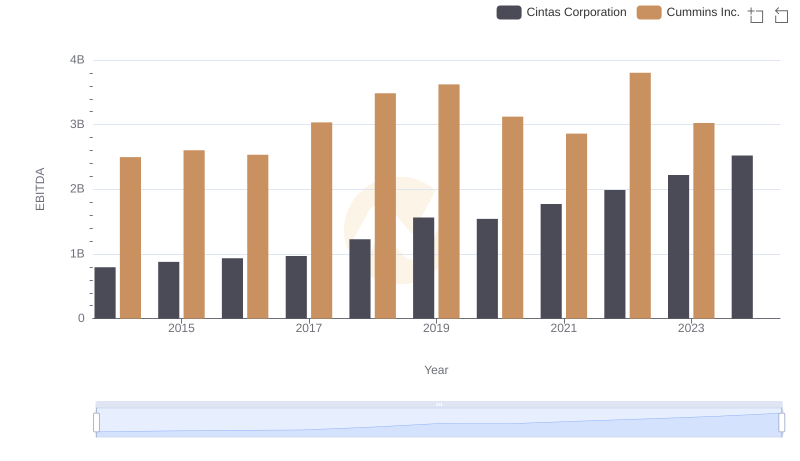
EBITDA Analysis: Evaluating Cintas Corporation Against Cummins Inc.