| __timestamp | Cintas Corporation | Cummins Inc. |
|---|---|---|
| Wednesday, January 1, 2014 | 793811000 | 2498000000 |
| Thursday, January 1, 2015 | 877761000 | 2604000000 |
| Friday, January 1, 2016 | 933728000 | 2534000000 |
| Sunday, January 1, 2017 | 968293000 | 3035000000 |
| Monday, January 1, 2018 | 1227852000 | 3486000000 |
| Tuesday, January 1, 2019 | 1564228000 | 3623000000 |
| Wednesday, January 1, 2020 | 1542737000 | 3125000000 |
| Friday, January 1, 2021 | 1773591000 | 2862000000 |
| Saturday, January 1, 2022 | 1990046000 | 3802000000 |
| Sunday, January 1, 2023 | 2221676000 | 3025000000 |
| Monday, January 1, 2024 | 2523857000 | 6338000000 |
Infusing magic into the data realm
In the ever-evolving landscape of corporate finance, EBITDA serves as a crucial metric for evaluating a company's operational performance. Over the past decade, Cintas Corporation and Cummins Inc. have demonstrated distinct trajectories in their EBITDA growth. From 2014 to 2023, Cintas Corporation's EBITDA surged by approximately 218%, reflecting a robust growth strategy and operational efficiency. In contrast, Cummins Inc. experienced a more modest increase of around 21% over the same period, highlighting a steady yet less aggressive expansion.
Notably, Cintas Corporation's EBITDA growth accelerated significantly post-2018, with a remarkable 29% increase from 2022 to 2023 alone. Meanwhile, Cummins Inc. faced fluctuations, with a peak in 2022 followed by a decline in 2023. This analysis underscores the dynamic nature of these industry leaders and offers valuable insights into their financial health and strategic direction.
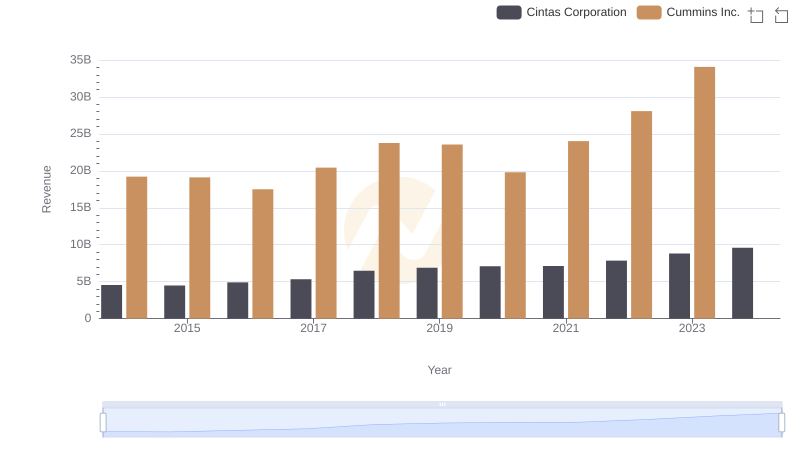
Comparing Revenue Performance: Cintas Corporation or Cummins Inc.?
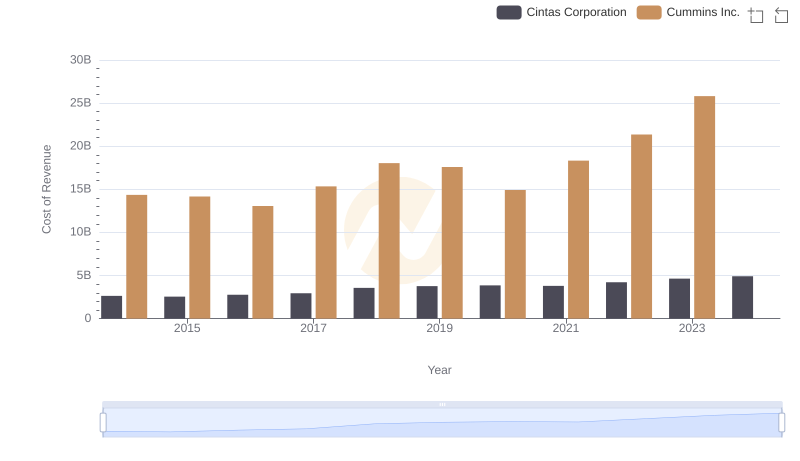
Cost Insights: Breaking Down Cintas Corporation and Cummins Inc.'s Expenses
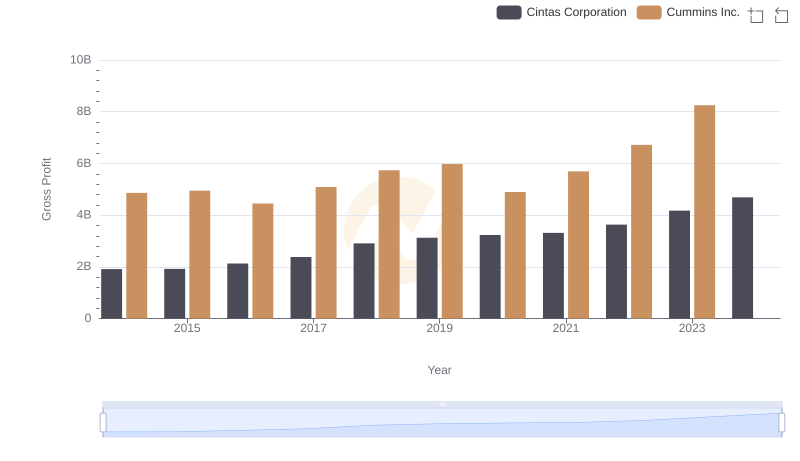
Gross Profit Trends Compared: Cintas Corporation vs Cummins Inc.
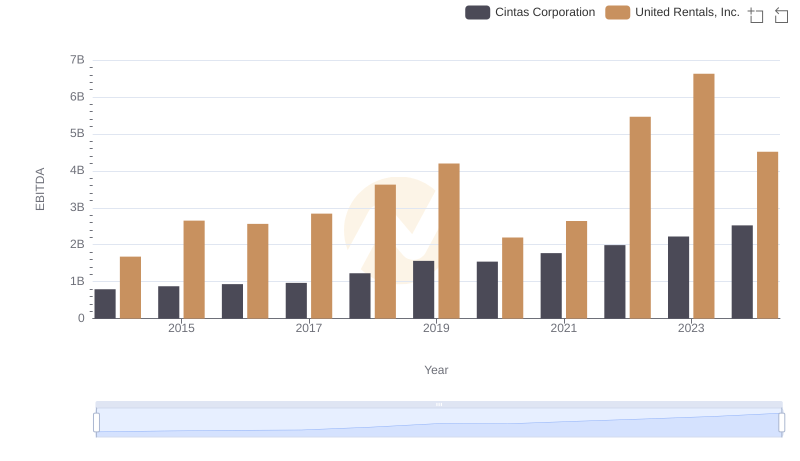
Comprehensive EBITDA Comparison: Cintas Corporation vs United Rentals, Inc.
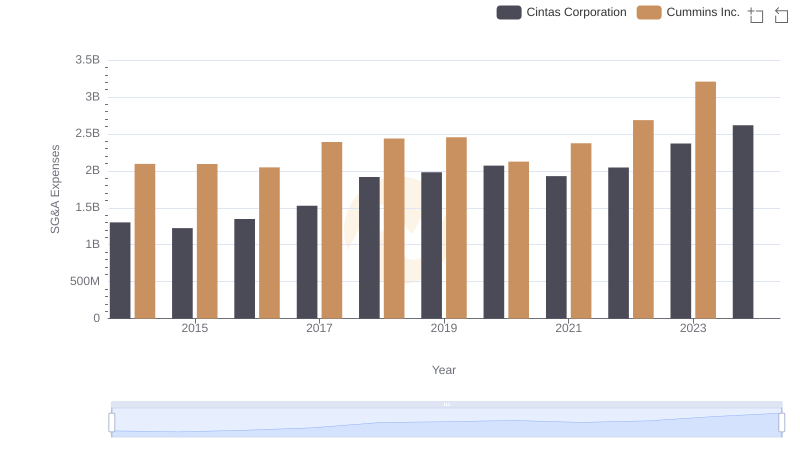
Breaking Down SG&A Expenses: Cintas Corporation vs Cummins Inc.
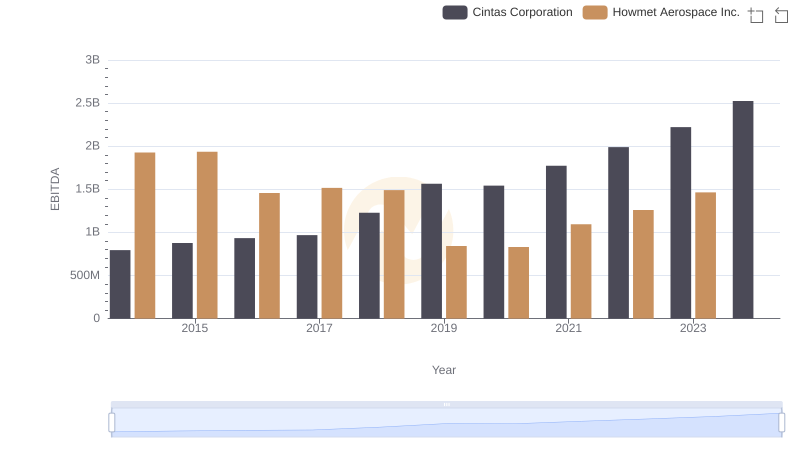
Professional EBITDA Benchmarking: Cintas Corporation vs Howmet Aerospace Inc.
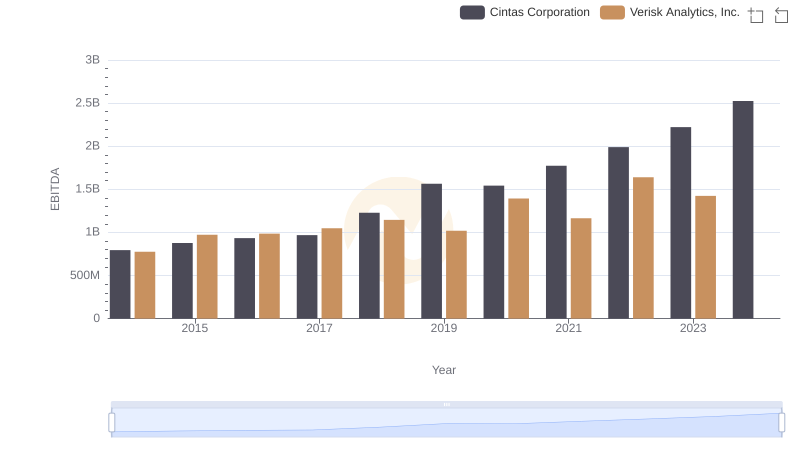
A Side-by-Side Analysis of EBITDA: Cintas Corporation and Verisk Analytics, Inc.
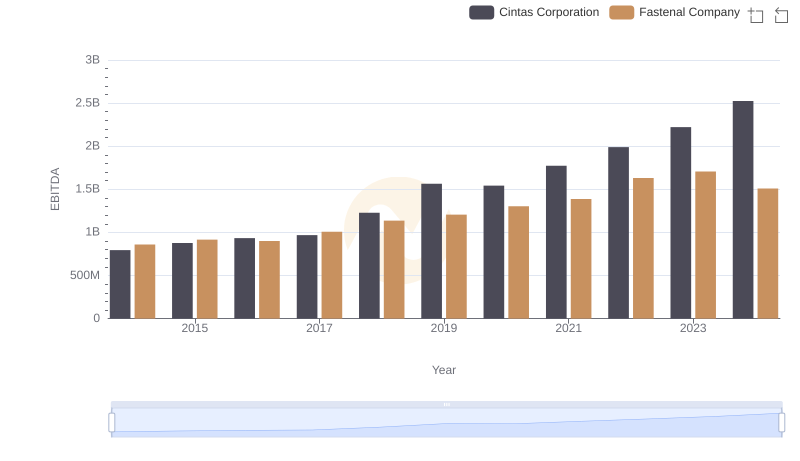
EBITDA Analysis: Evaluating Cintas Corporation Against Fastenal Company
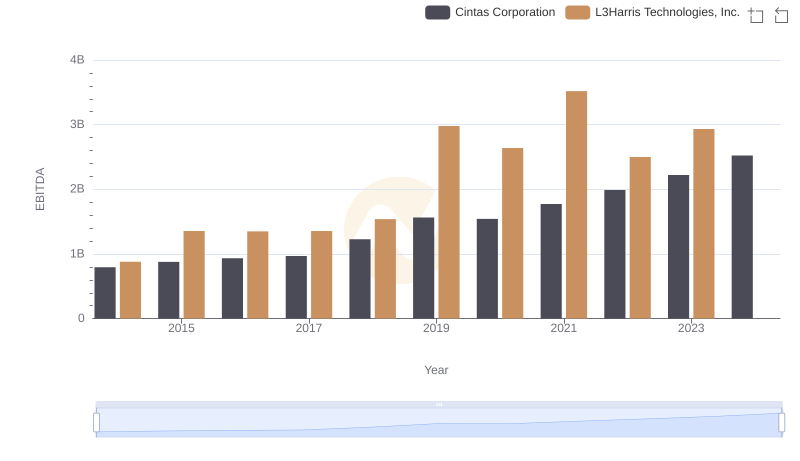
Comprehensive EBITDA Comparison: Cintas Corporation vs L3Harris Technologies, Inc.
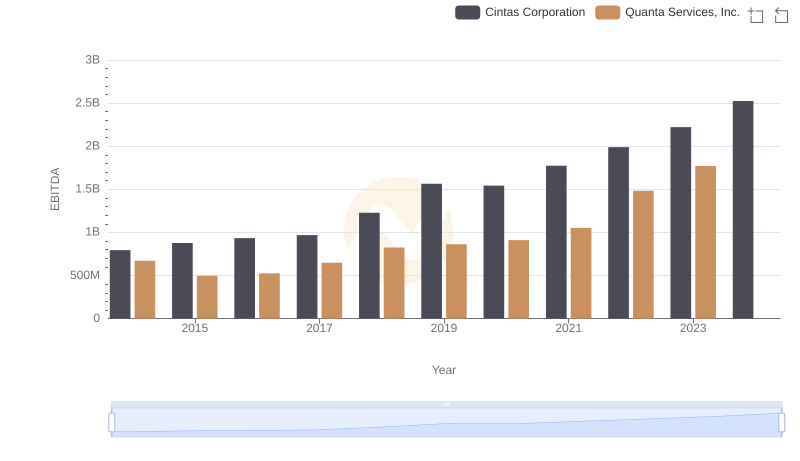
Comparative EBITDA Analysis: Cintas Corporation vs Quanta Services, Inc.
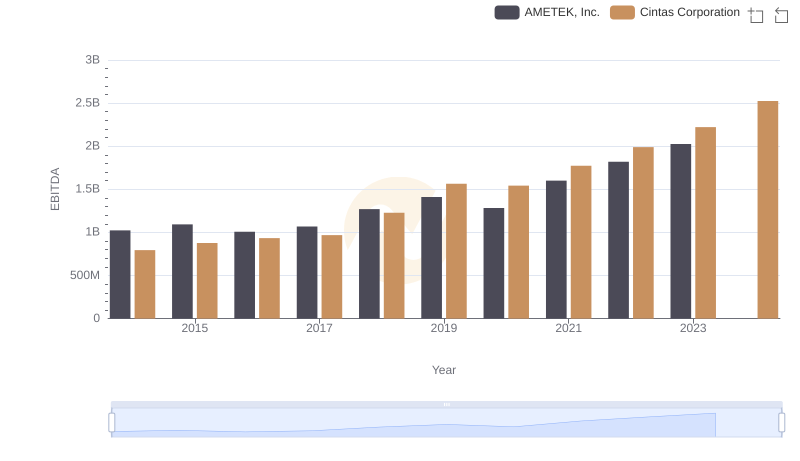
Cintas Corporation vs AMETEK, Inc.: In-Depth EBITDA Performance Comparison
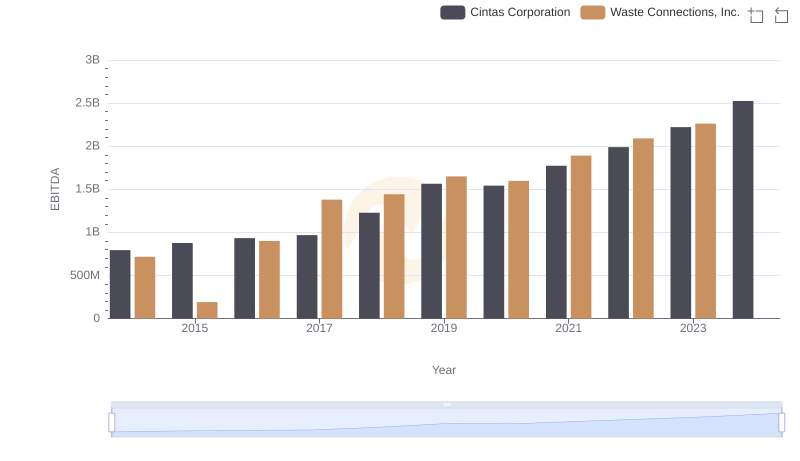
A Side-by-Side Analysis of EBITDA: Cintas Corporation and Waste Connections, Inc.