| __timestamp | Cintas Corporation | L3Harris Technologies, Inc. |
|---|---|---|
| Wednesday, January 1, 2014 | 1914386000 | 1515000000 |
| Thursday, January 1, 2015 | 1921337000 | 2160000000 |
| Friday, January 1, 2016 | 2129870000 | 2043000000 |
| Sunday, January 1, 2017 | 2380295000 | 2102000000 |
| Monday, January 1, 2018 | 2908523000 | 2334000000 |
| Tuesday, January 1, 2019 | 3128588000 | 5074000000 |
| Wednesday, January 1, 2020 | 3233748000 | 5308000000 |
| Friday, January 1, 2021 | 3314651000 | 5376000000 |
| Saturday, January 1, 2022 | 3632246000 | 4927000000 |
| Sunday, January 1, 2023 | 4173368000 | 5113000000 |
| Monday, January 1, 2024 | 4686416000 | 5524000000 |
Infusing magic into the data realm
In the competitive landscape of American industry, Cintas Corporation and L3Harris Technologies, Inc. have showcased intriguing trends in gross profit over the past decade. From 2014 to 2023, Cintas Corporation has seen a robust growth trajectory, with its gross profit increasing by approximately 145%, from $1.9 billion to $4.2 billion. This reflects a consistent annual growth rate, highlighting Cintas's strategic prowess in the uniform and facility services sector.
Conversely, L3Harris Technologies, a key player in the defense and aerospace industry, experienced a significant surge in 2019, with gross profits peaking at $5.4 billion in 2021. However, the data for 2024 is missing, leaving room for speculation on future trends. This comparison not only underscores the resilience of these corporations but also offers insights into their strategic adaptations in a dynamic market environment.
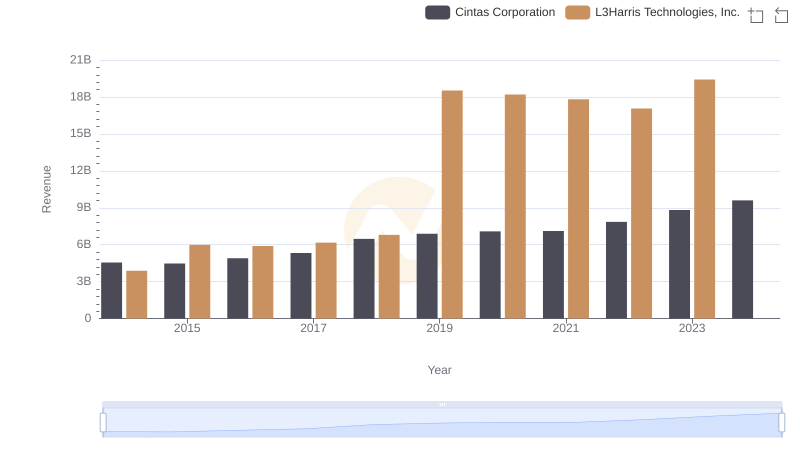
Cintas Corporation and L3Harris Technologies, Inc.: A Comprehensive Revenue Analysis
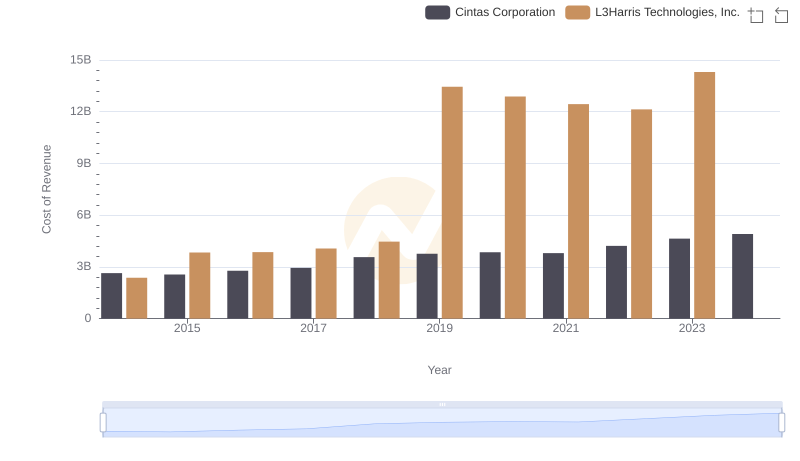
Analyzing Cost of Revenue: Cintas Corporation and L3Harris Technologies, Inc.
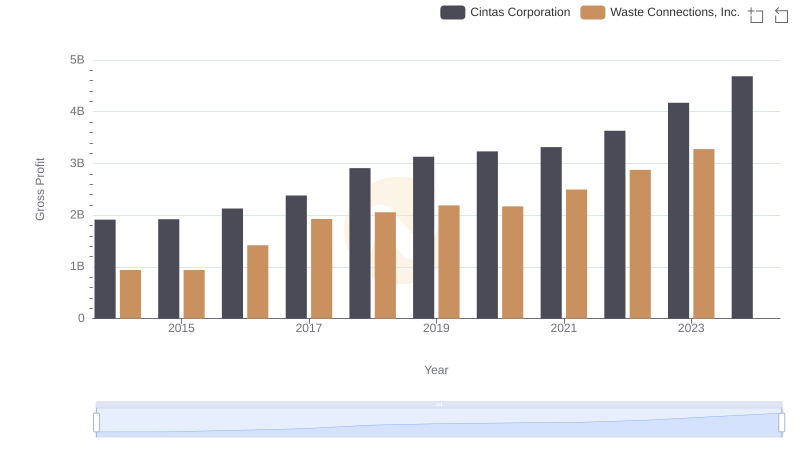
Key Insights on Gross Profit: Cintas Corporation vs Waste Connections, Inc.
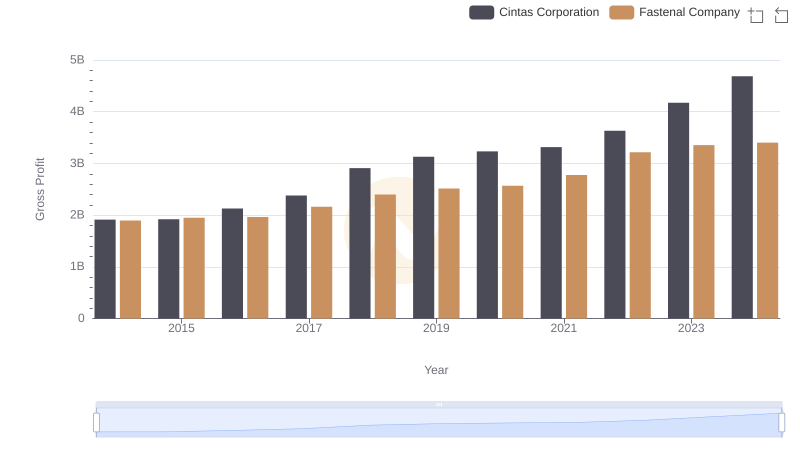
Key Insights on Gross Profit: Cintas Corporation vs Fastenal Company
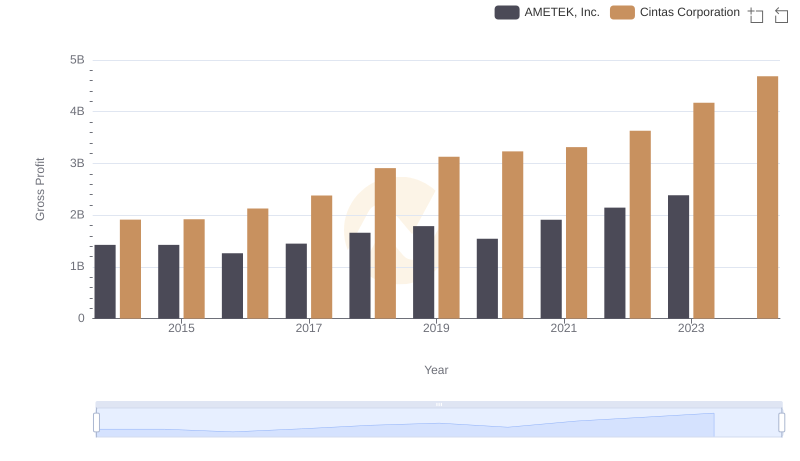
Cintas Corporation vs AMETEK, Inc.: A Gross Profit Performance Breakdown
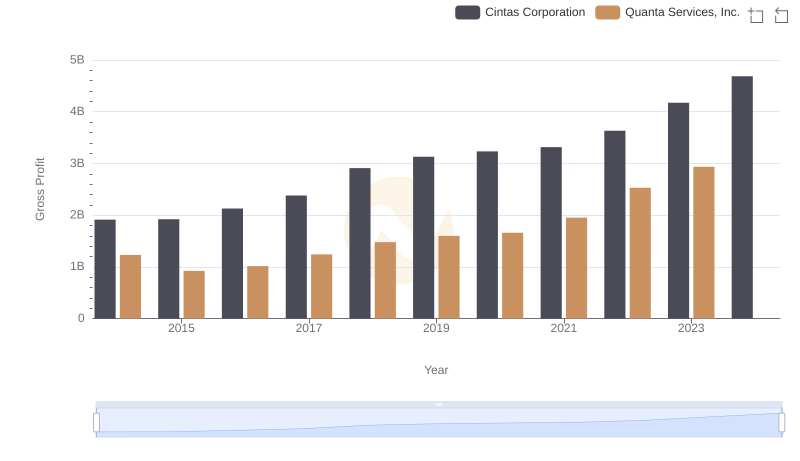
Gross Profit Comparison: Cintas Corporation and Quanta Services, Inc. Trends
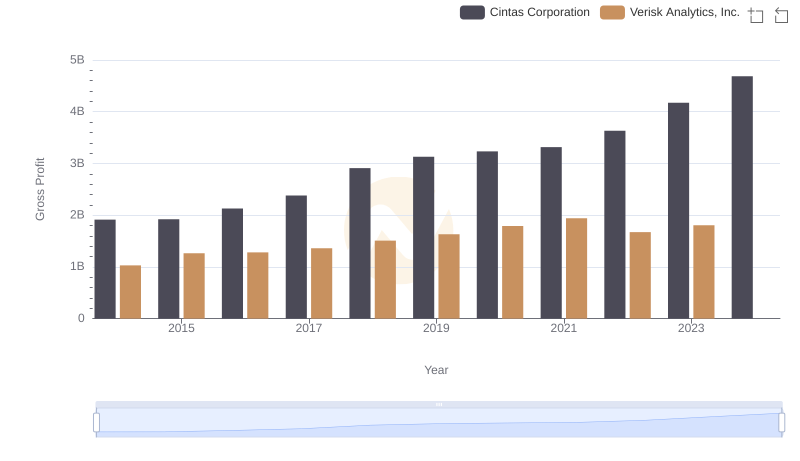
Cintas Corporation and Verisk Analytics, Inc.: A Detailed Gross Profit Analysis
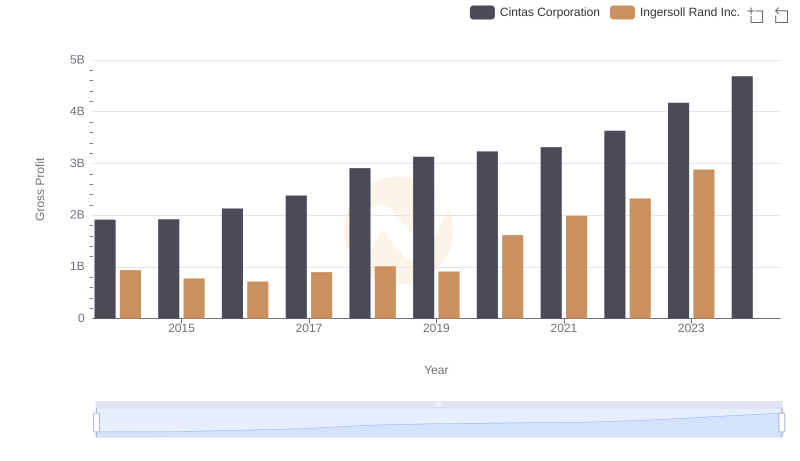
Gross Profit Trends Compared: Cintas Corporation vs Ingersoll Rand Inc.
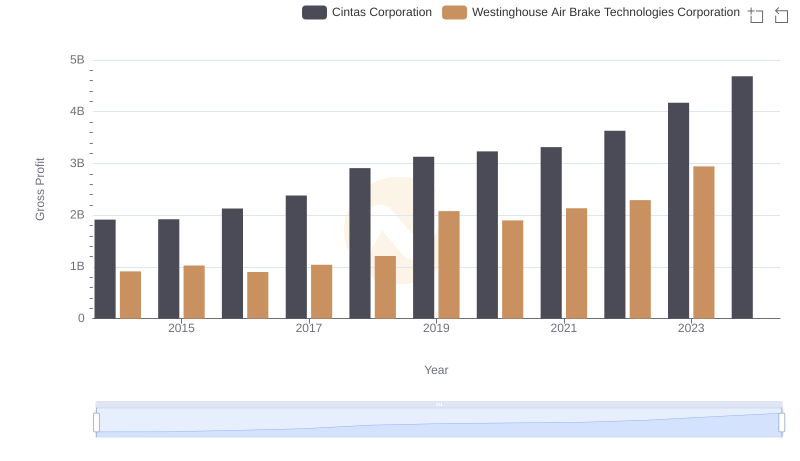
Who Generates Higher Gross Profit? Cintas Corporation or Westinghouse Air Brake Technologies Corporation

Gross Profit Analysis: Comparing Cintas Corporation and Old Dominion Freight Line, Inc.
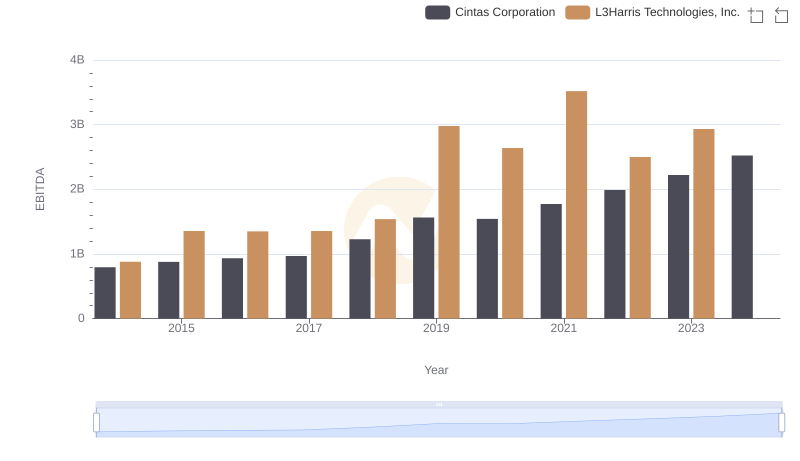
Comprehensive EBITDA Comparison: Cintas Corporation vs L3Harris Technologies, Inc.