| __timestamp | Cintas Corporation | Cummins Inc. |
|---|---|---|
| Wednesday, January 1, 2014 | 2637426000 | 14360000000 |
| Thursday, January 1, 2015 | 2555549000 | 14163000000 |
| Friday, January 1, 2016 | 2775588000 | 13057000000 |
| Sunday, January 1, 2017 | 2943086000 | 15338000000 |
| Monday, January 1, 2018 | 3568109000 | 18034000000 |
| Tuesday, January 1, 2019 | 3763715000 | 17591000000 |
| Wednesday, January 1, 2020 | 3851372000 | 14917000000 |
| Friday, January 1, 2021 | 3801689000 | 18326000000 |
| Saturday, January 1, 2022 | 4222213000 | 21355000000 |
| Sunday, January 1, 2023 | 4642401000 | 25816000000 |
| Monday, January 1, 2024 | 4910199000 | 25663000000 |
Cracking the code
In the ever-evolving landscape of corporate finance, understanding cost structures is pivotal. This analysis delves into the cost of revenue trends for Cintas Corporation and Cummins Inc. from 2014 to 2023. Over this decade, Cintas Corporation's cost of revenue surged by approximately 86%, reflecting its strategic growth and operational expansion. In contrast, Cummins Inc. experienced a 79% increase, highlighting its robust market presence and adaptability.
The data for 2024 is incomplete, indicating potential shifts in financial strategies. This comparative analysis underscores the dynamic nature of cost management in these industry giants.
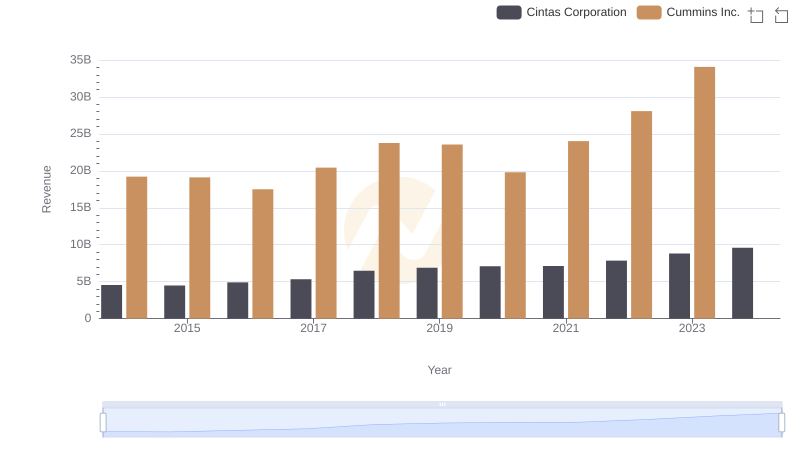
Comparing Revenue Performance: Cintas Corporation or Cummins Inc.?
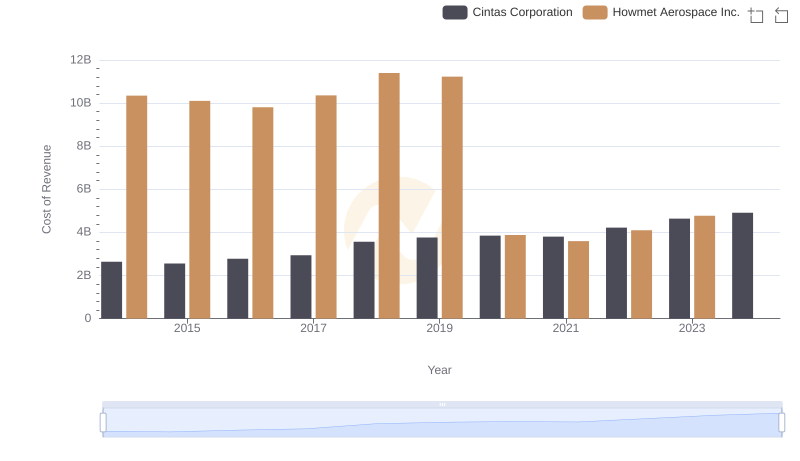
Cost of Revenue Comparison: Cintas Corporation vs Howmet Aerospace Inc.
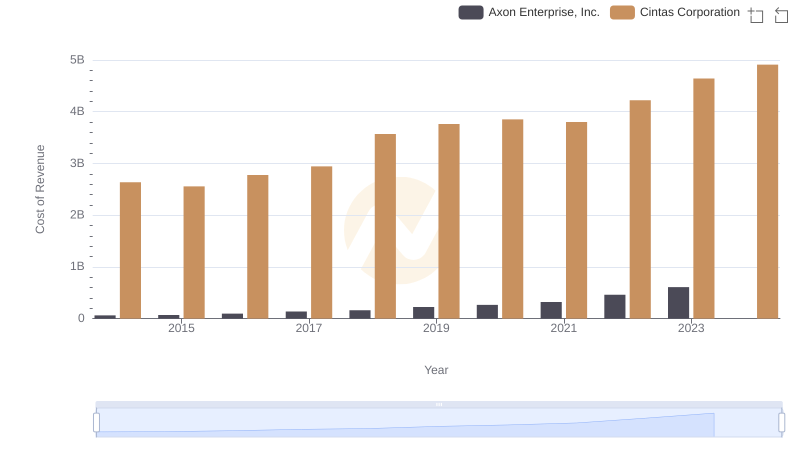
Cost of Revenue: Key Insights for Cintas Corporation and Axon Enterprise, Inc.
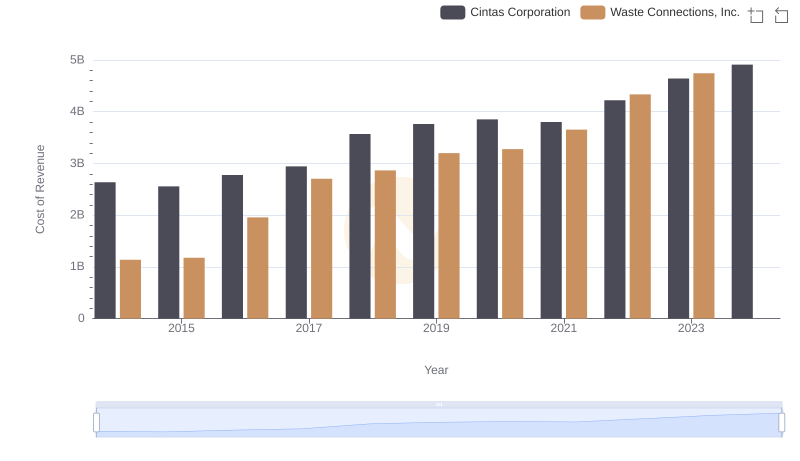
Cost of Revenue Comparison: Cintas Corporation vs Waste Connections, Inc.
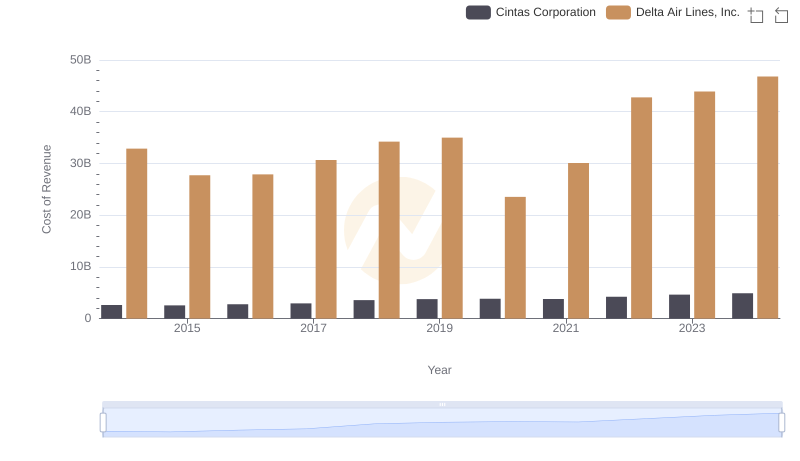
Cost Insights: Breaking Down Cintas Corporation and Delta Air Lines, Inc.'s Expenses
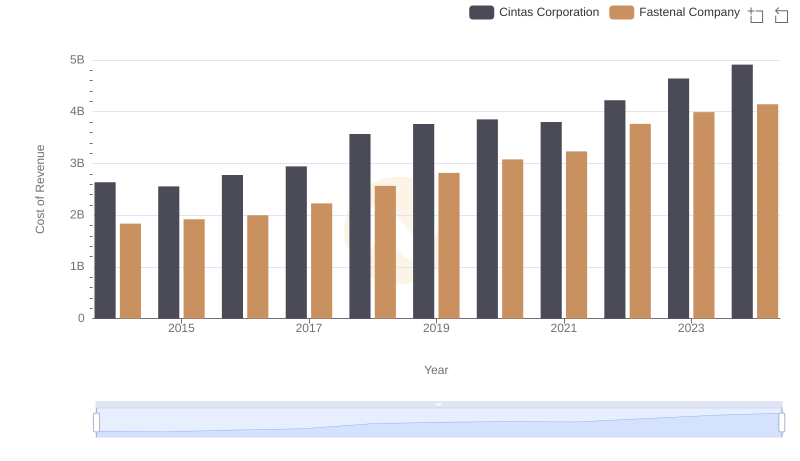
Cost of Revenue Trends: Cintas Corporation vs Fastenal Company
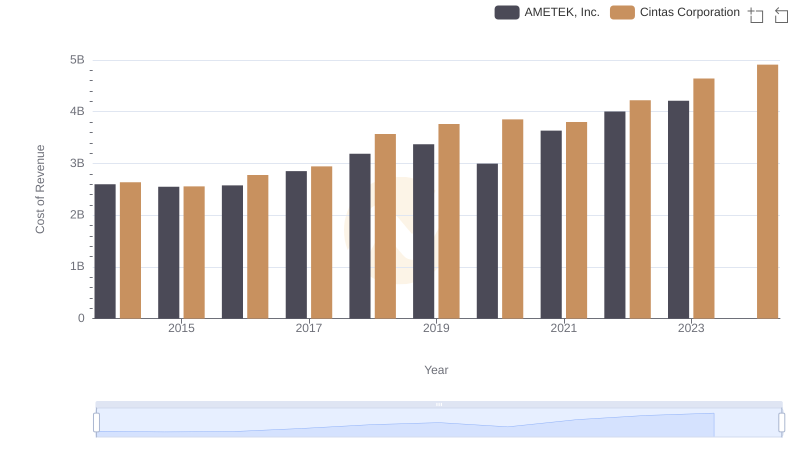
Analyzing Cost of Revenue: Cintas Corporation and AMETEK, Inc.
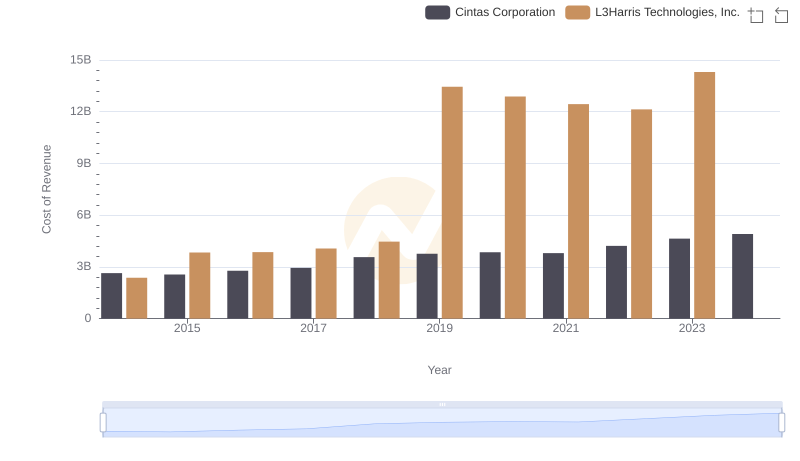
Analyzing Cost of Revenue: Cintas Corporation and L3Harris Technologies, Inc.
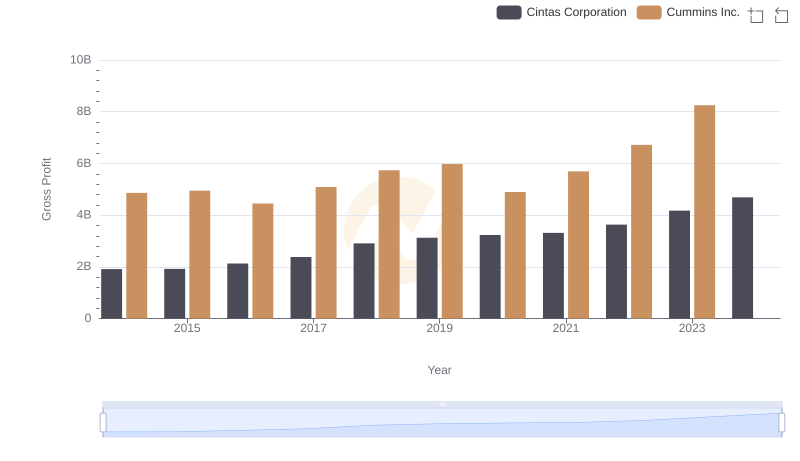
Gross Profit Trends Compared: Cintas Corporation vs Cummins Inc.
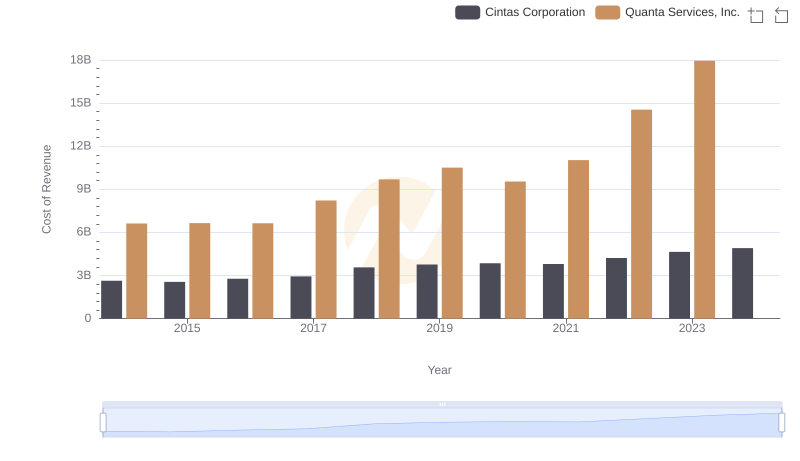
Analyzing Cost of Revenue: Cintas Corporation and Quanta Services, Inc.
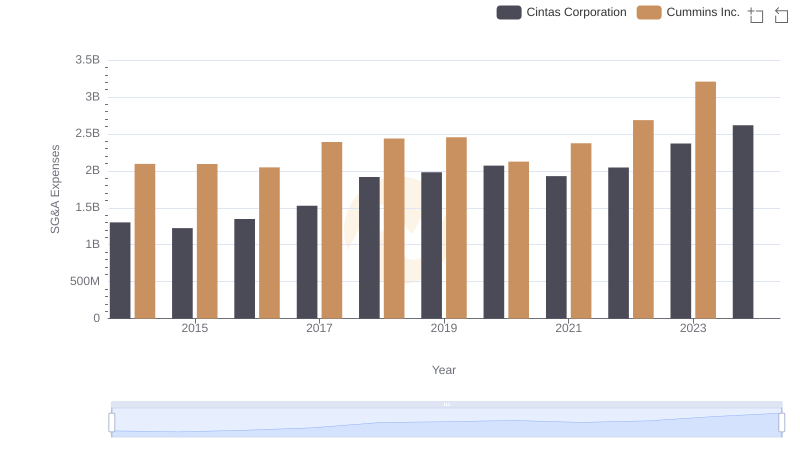
Breaking Down SG&A Expenses: Cintas Corporation vs Cummins Inc.
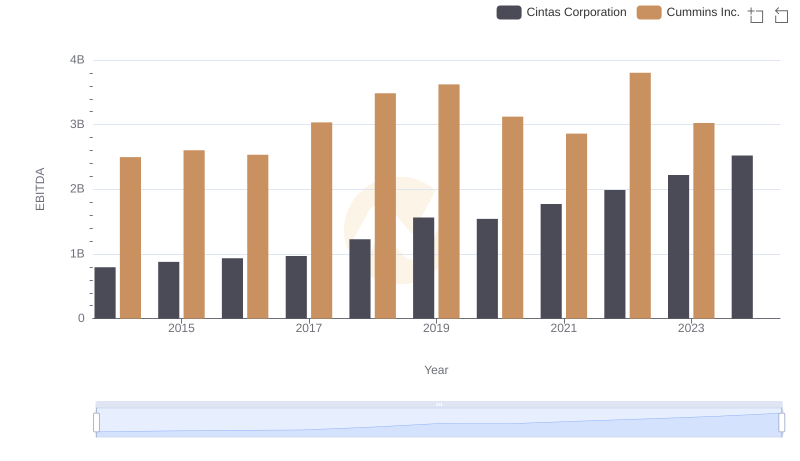
EBITDA Analysis: Evaluating Cintas Corporation Against Cummins Inc.