| __timestamp | Cintas Corporation | Fastenal Company |
|---|---|---|
| Wednesday, January 1, 2014 | 1914386000 | 1897402000 |
| Thursday, January 1, 2015 | 1921337000 | 1948934000 |
| Friday, January 1, 2016 | 2129870000 | 1964777000 |
| Sunday, January 1, 2017 | 2380295000 | 2163600000 |
| Monday, January 1, 2018 | 2908523000 | 2398900000 |
| Tuesday, January 1, 2019 | 3128588000 | 2515400000 |
| Wednesday, January 1, 2020 | 3233748000 | 2567800000 |
| Friday, January 1, 2021 | 3314651000 | 2777200000 |
| Saturday, January 1, 2022 | 3632246000 | 3215800000 |
| Sunday, January 1, 2023 | 4173368000 | 3354500000 |
| Monday, January 1, 2024 | 4686416000 | 3401900000 |
Unlocking the unknown
In the competitive landscape of industrial services, Cintas Corporation and Fastenal Company have demonstrated remarkable growth over the past decade. From 2014 to 2024, Cintas Corporation's gross profit surged by approximately 145%, starting from $1.9 billion and reaching an impressive $4.7 billion. Fastenal Company, while slightly trailing, also showcased a robust growth of around 79%, with gross profits climbing from $1.9 billion to $3.4 billion.
This data underscores the dynamic nature of the industrial sector, where strategic initiatives and market adaptability play crucial roles in financial performance.
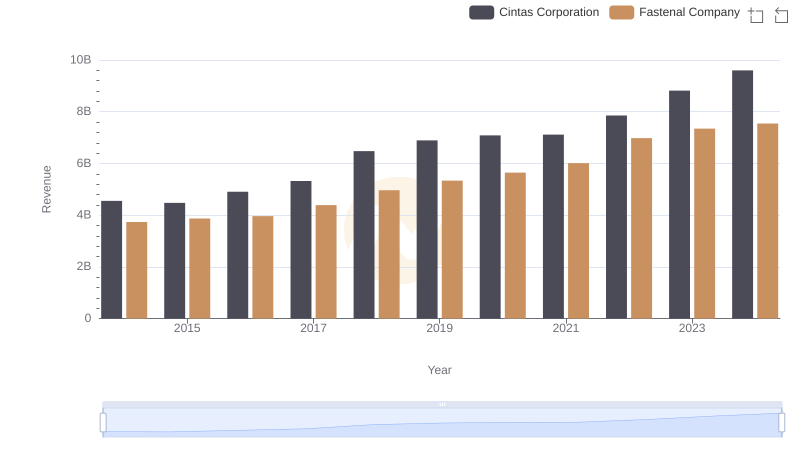
Cintas Corporation vs Fastenal Company: Examining Key Revenue Metrics
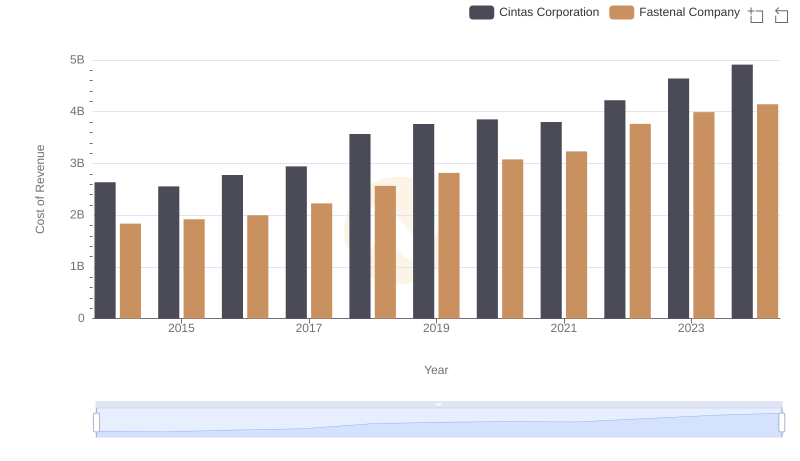
Cost of Revenue Trends: Cintas Corporation vs Fastenal Company
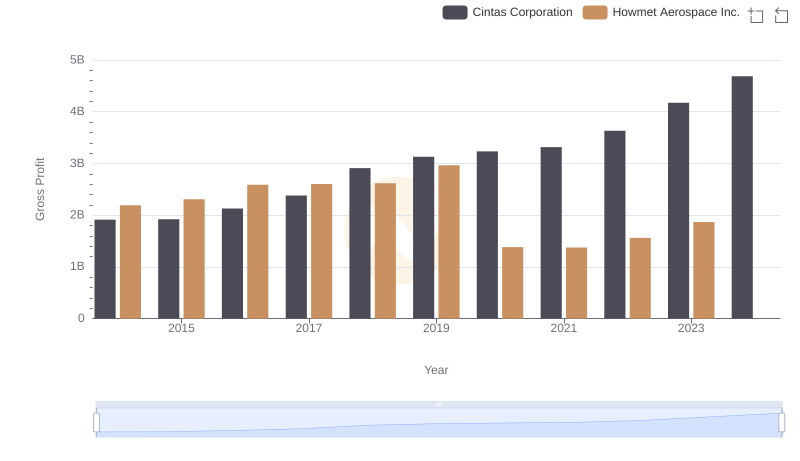
Who Generates Higher Gross Profit? Cintas Corporation or Howmet Aerospace Inc.
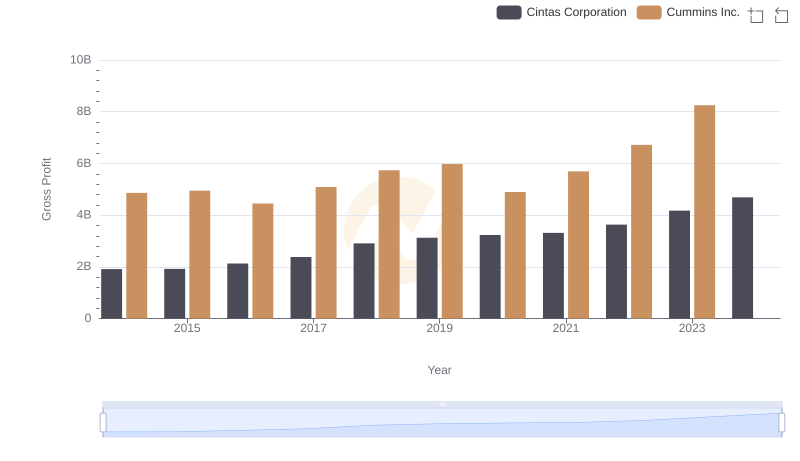
Gross Profit Trends Compared: Cintas Corporation vs Cummins Inc.
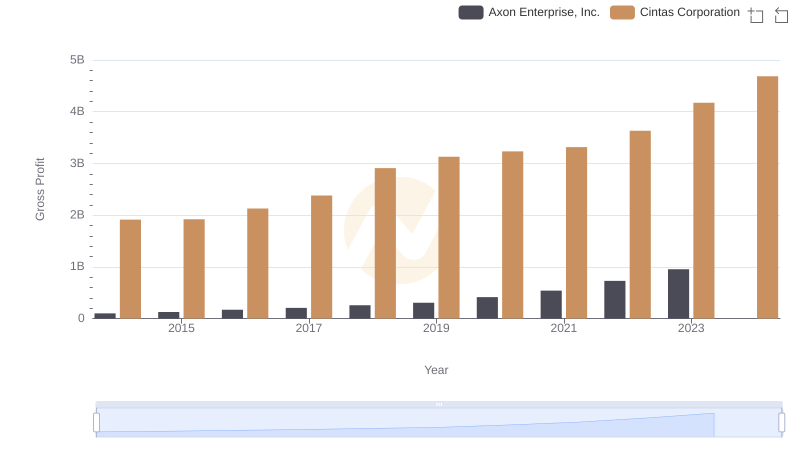
Key Insights on Gross Profit: Cintas Corporation vs Axon Enterprise, Inc.
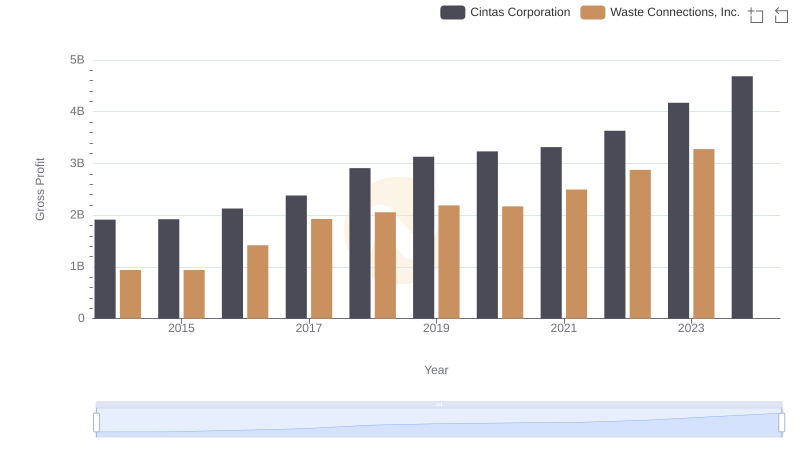
Key Insights on Gross Profit: Cintas Corporation vs Waste Connections, Inc.
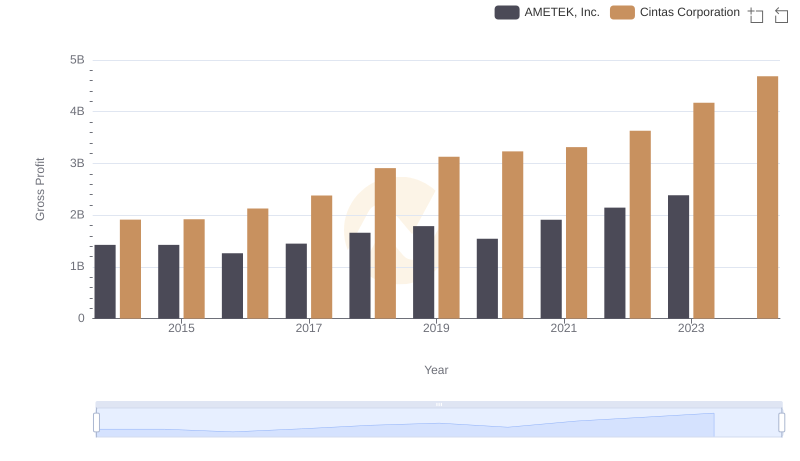
Cintas Corporation vs AMETEK, Inc.: A Gross Profit Performance Breakdown
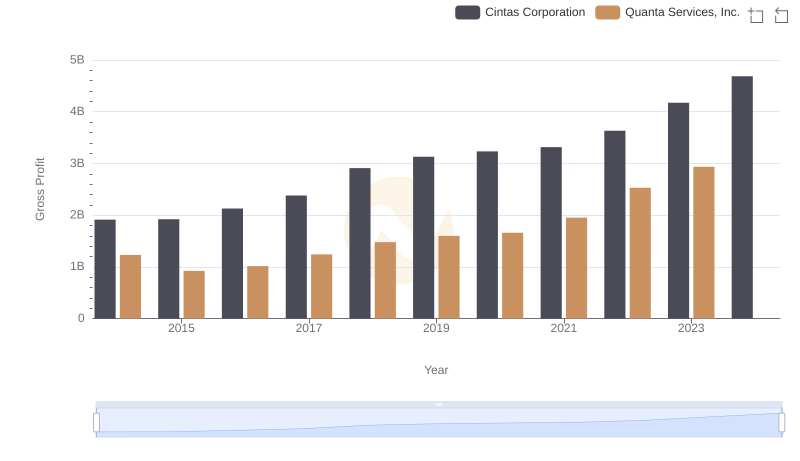
Gross Profit Comparison: Cintas Corporation and Quanta Services, Inc. Trends
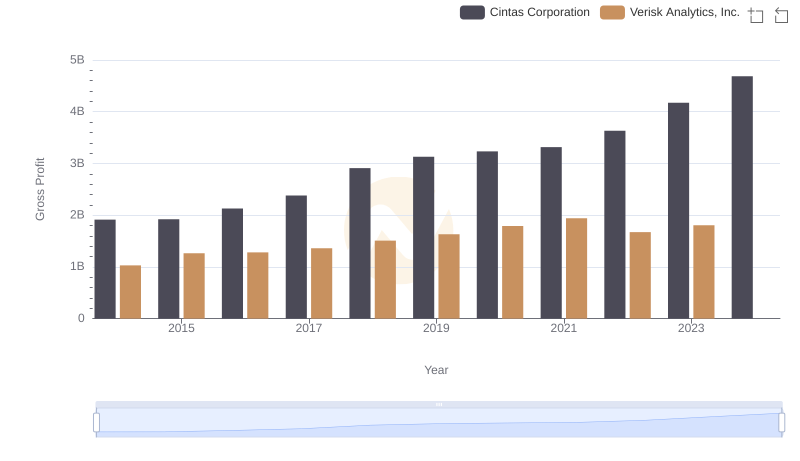
Cintas Corporation and Verisk Analytics, Inc.: A Detailed Gross Profit Analysis
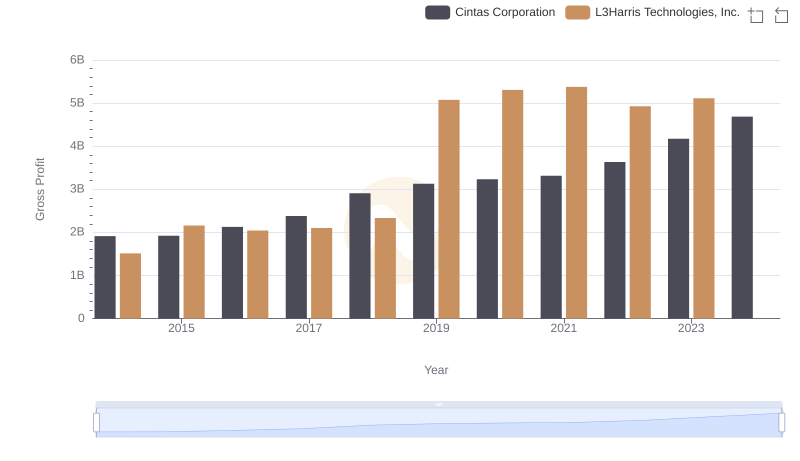
Gross Profit Trends Compared: Cintas Corporation vs L3Harris Technologies, Inc.
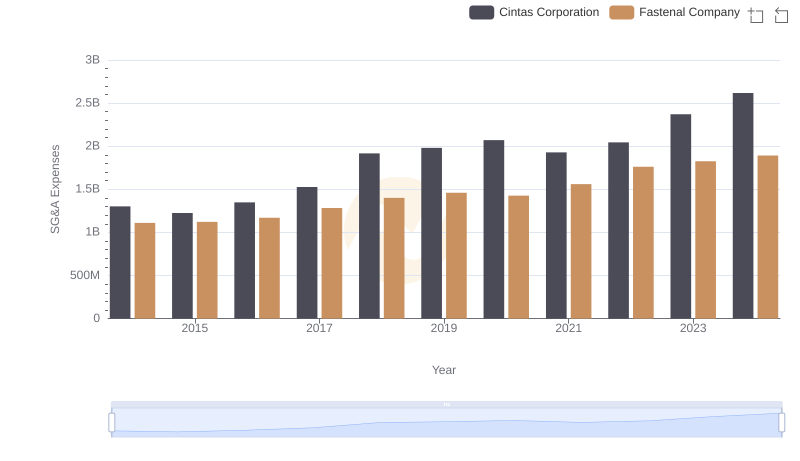
Cintas Corporation vs Fastenal Company: SG&A Expense Trends
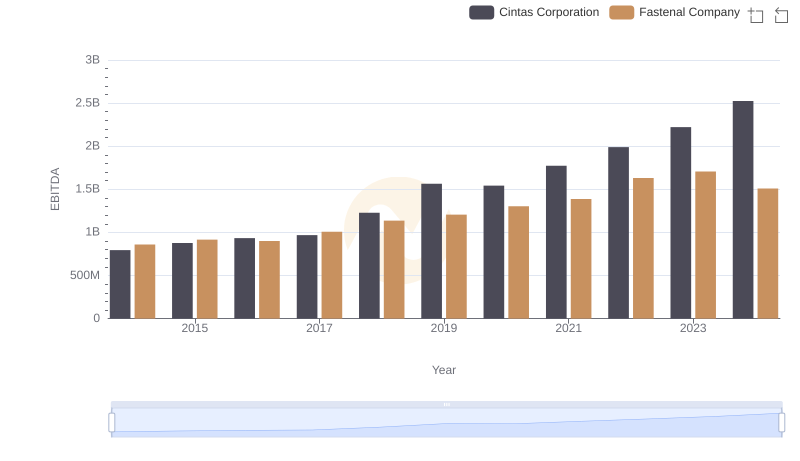
EBITDA Analysis: Evaluating Cintas Corporation Against Fastenal Company