| __timestamp | Cintas Corporation | Quanta Services, Inc. |
|---|---|---|
| Wednesday, January 1, 2014 | 2637426000 | 6617730000 |
| Thursday, January 1, 2015 | 2555549000 | 6648771000 |
| Friday, January 1, 2016 | 2775588000 | 6637519000 |
| Sunday, January 1, 2017 | 2943086000 | 8224618000 |
| Monday, January 1, 2018 | 3568109000 | 9691459000 |
| Tuesday, January 1, 2019 | 3763715000 | 10511901000 |
| Wednesday, January 1, 2020 | 3851372000 | 9541825000 |
| Friday, January 1, 2021 | 3801689000 | 11026954000 |
| Saturday, January 1, 2022 | 4222213000 | 14544748000 |
| Sunday, January 1, 2023 | 4642401000 | 17945120000 |
| Monday, January 1, 2024 | 4910199000 |
Igniting the spark of knowledge
In the ever-evolving landscape of corporate America, understanding the cost of revenue is crucial for evaluating a company's financial health. This analysis focuses on two industry leaders: Cintas Corporation and Quanta Services, Inc., from 2014 to 2023.
Cintas, a leader in corporate identity uniforms, has seen its cost of revenue grow steadily. From 2014 to 2023, Cintas experienced a 86% increase, peaking at nearly $4.9 billion in 2023. This growth reflects the company's expanding market presence and operational scale.
Quanta Services, a key player in infrastructure solutions, showcases a more dramatic trajectory. From 2014 to 2023, its cost of revenue surged by approximately 171%, reaching a staggering $17.9 billion in 2023. This growth underscores Quanta's aggressive expansion and strategic acquisitions.
While Cintas shows consistent growth, Quanta's rapid rise highlights its dynamic approach in a competitive market. However, data for 2024 remains incomplete, leaving room for future insights.
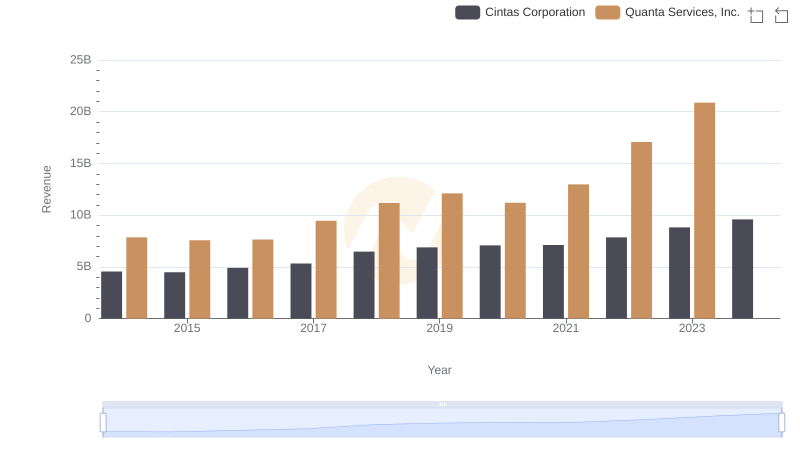
Who Generates More Revenue? Cintas Corporation or Quanta Services, Inc.
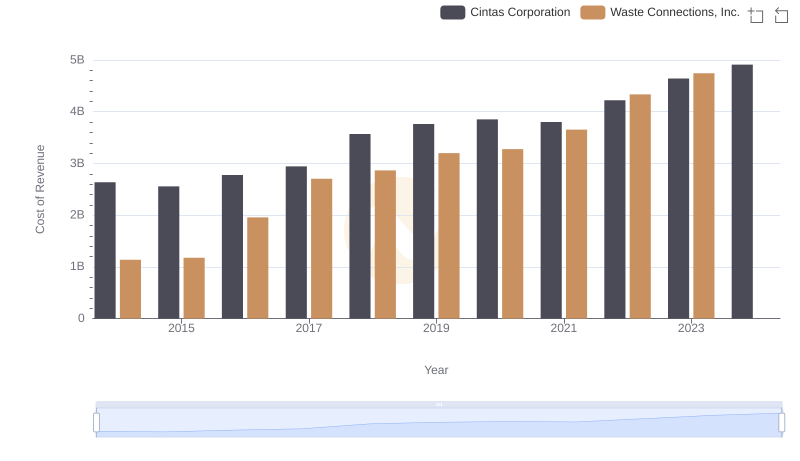
Cost of Revenue Comparison: Cintas Corporation vs Waste Connections, Inc.
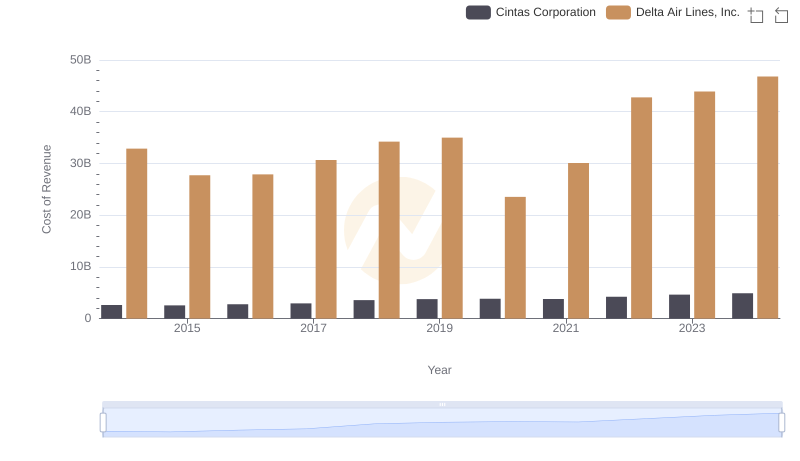
Cost Insights: Breaking Down Cintas Corporation and Delta Air Lines, Inc.'s Expenses
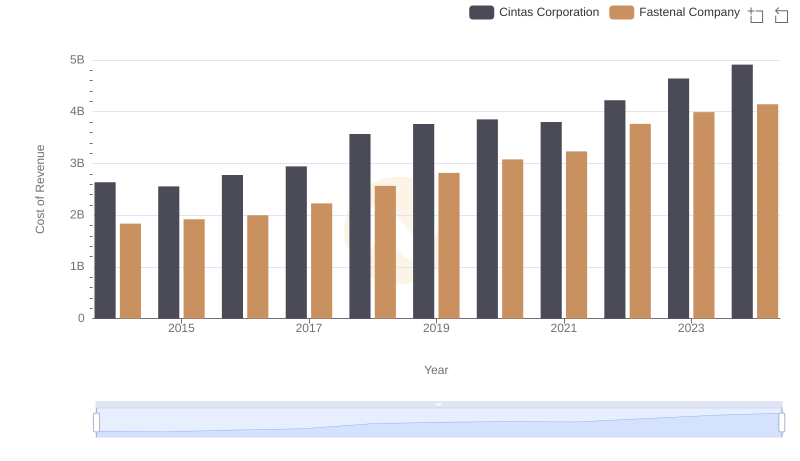
Cost of Revenue Trends: Cintas Corporation vs Fastenal Company
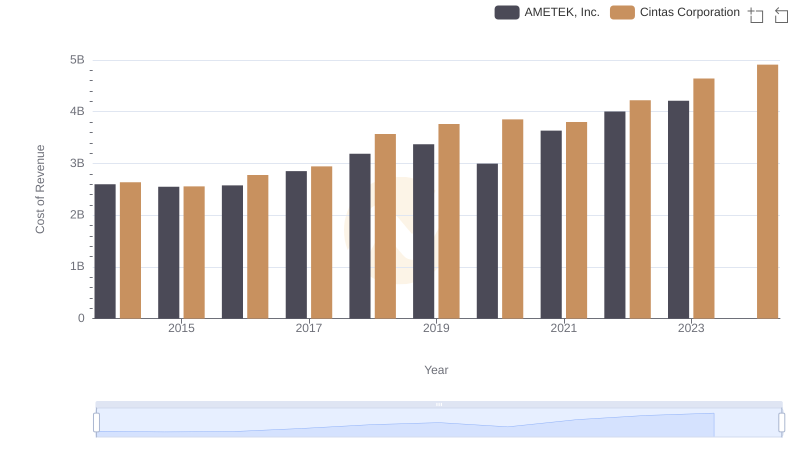
Analyzing Cost of Revenue: Cintas Corporation and AMETEK, Inc.
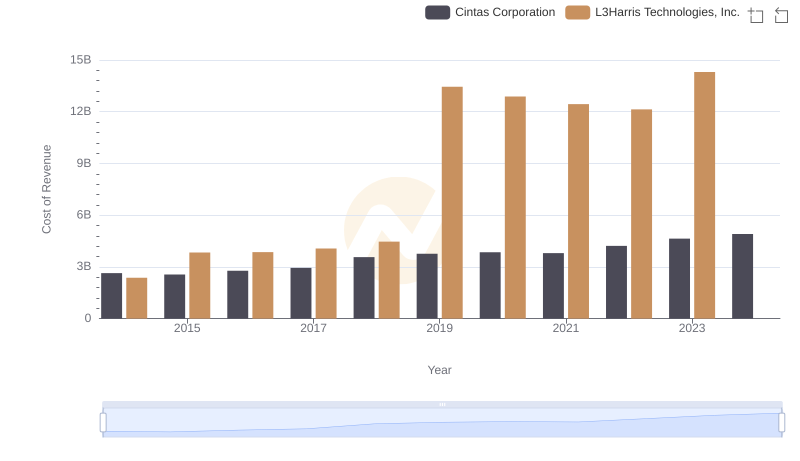
Analyzing Cost of Revenue: Cintas Corporation and L3Harris Technologies, Inc.
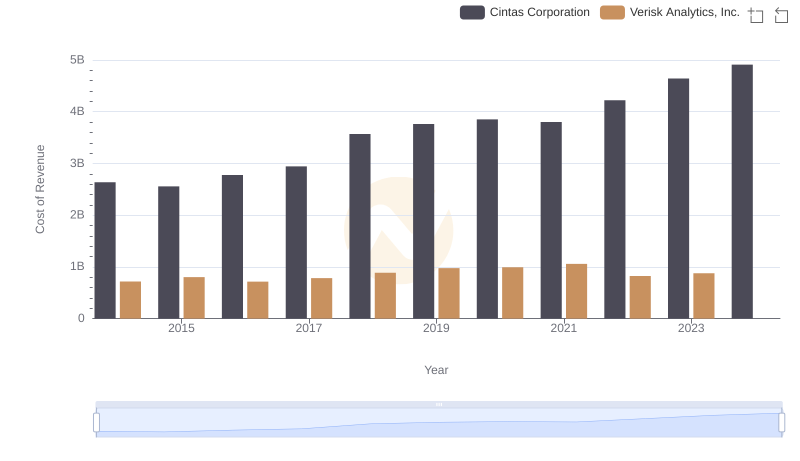
Cost Insights: Breaking Down Cintas Corporation and Verisk Analytics, Inc.'s Expenses
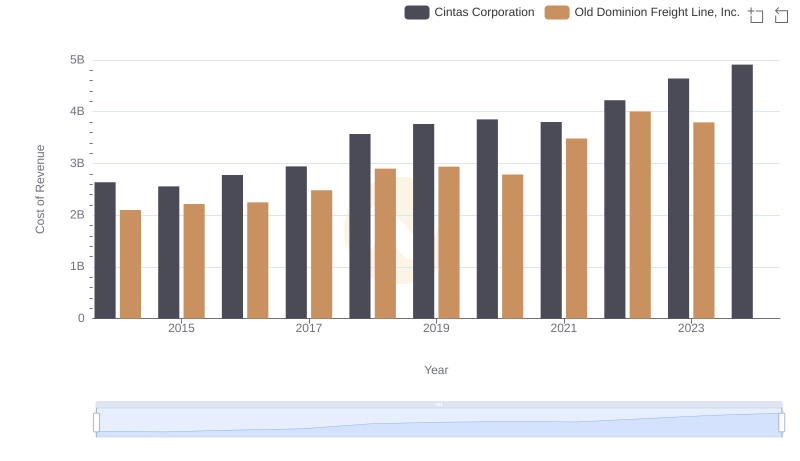
Cost Insights: Breaking Down Cintas Corporation and Old Dominion Freight Line, Inc.'s Expenses
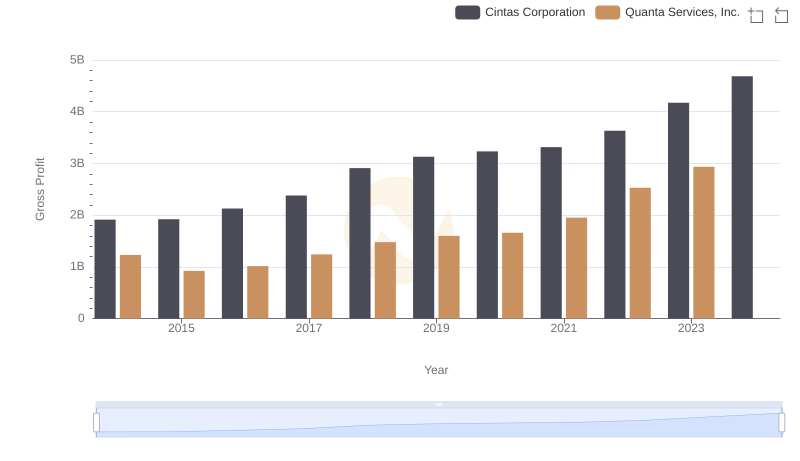
Gross Profit Comparison: Cintas Corporation and Quanta Services, Inc. Trends
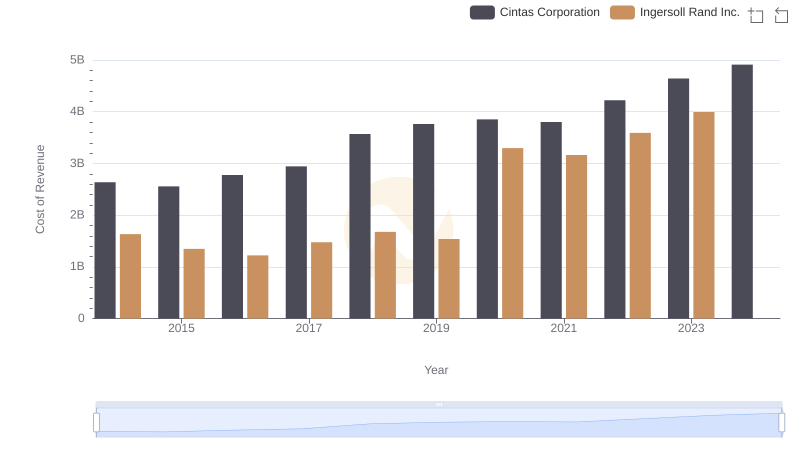
Cost Insights: Breaking Down Cintas Corporation and Ingersoll Rand Inc.'s Expenses
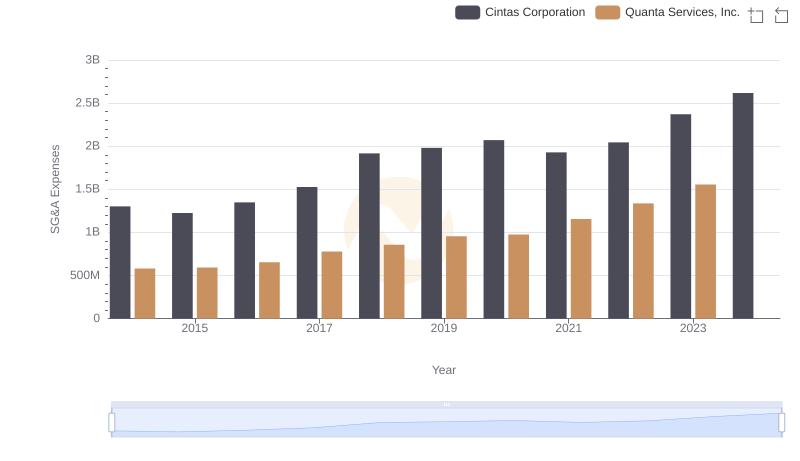
Who Optimizes SG&A Costs Better? Cintas Corporation or Quanta Services, Inc.
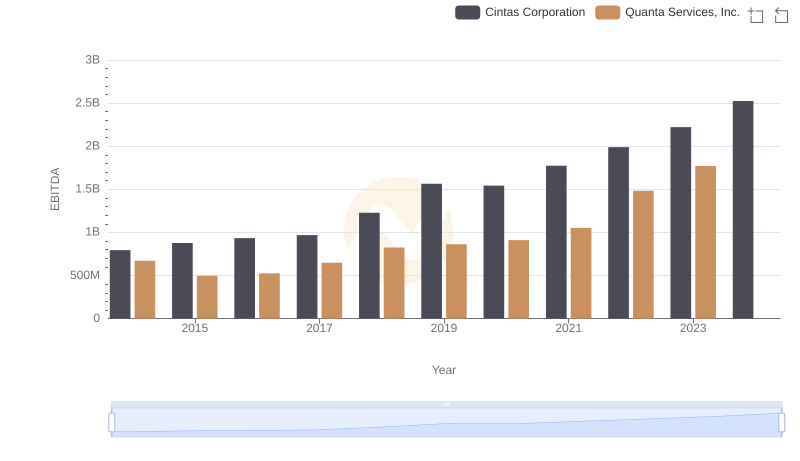
Comparative EBITDA Analysis: Cintas Corporation vs Quanta Services, Inc.