| __timestamp | Cintas Corporation | Quanta Services, Inc. |
|---|---|---|
| Wednesday, January 1, 2014 | 793811000 | 671899000 |
| Thursday, January 1, 2015 | 877761000 | 497247000 |
| Friday, January 1, 2016 | 933728000 | 524498000 |
| Sunday, January 1, 2017 | 968293000 | 647748000 |
| Monday, January 1, 2018 | 1227852000 | 824909000 |
| Tuesday, January 1, 2019 | 1564228000 | 862368000 |
| Wednesday, January 1, 2020 | 1542737000 | 911029000 |
| Friday, January 1, 2021 | 1773591000 | 1052832000 |
| Saturday, January 1, 2022 | 1990046000 | 1483091000 |
| Sunday, January 1, 2023 | 2221676000 | 1770669000 |
| Monday, January 1, 2024 | 2523857000 |
Unleashing insights
In the ever-evolving landscape of corporate finance, EBITDA serves as a crucial indicator of a company's operational efficiency. Over the past decade, Cintas Corporation and Quanta Services, Inc. have demonstrated remarkable growth in this metric. From 2014 to 2023, Cintas Corporation's EBITDA surged by approximately 217%, reflecting its robust business model and strategic expansions. In contrast, Quanta Services, Inc. experienced a 163% increase, showcasing its resilience and adaptability in a competitive market.
This comparative analysis highlights the dynamic growth patterns of these industry leaders, offering valuable insights for investors and stakeholders.
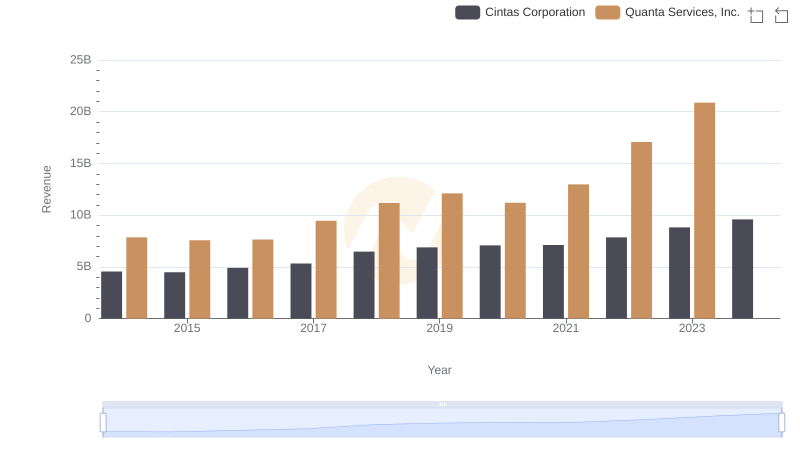
Who Generates More Revenue? Cintas Corporation or Quanta Services, Inc.
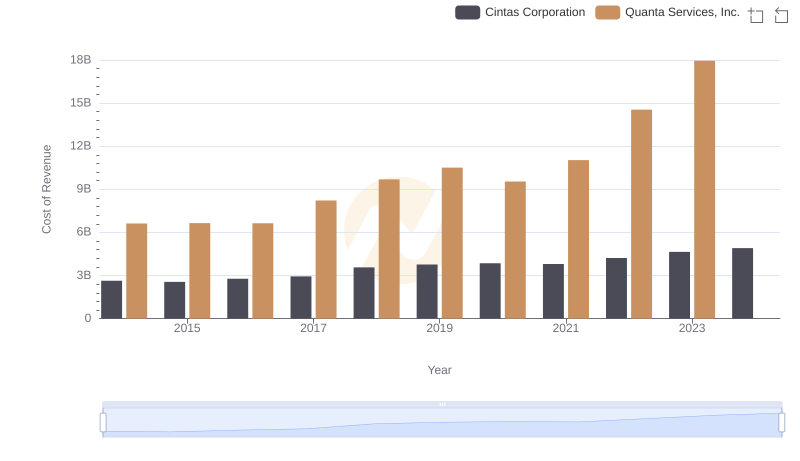
Analyzing Cost of Revenue: Cintas Corporation and Quanta Services, Inc.
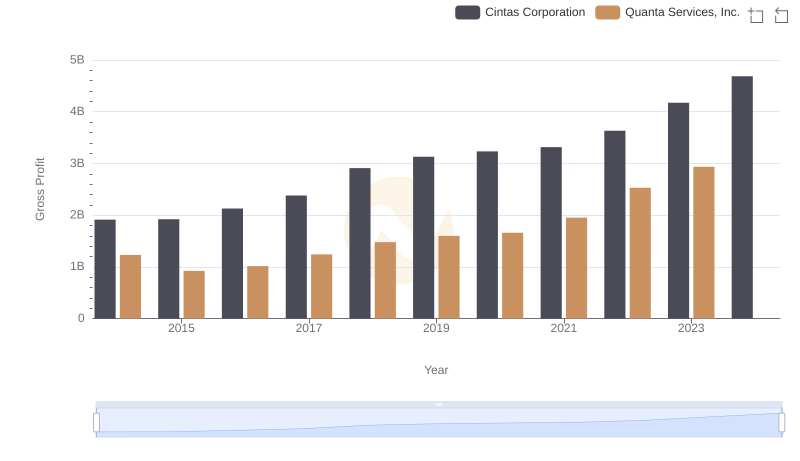
Gross Profit Comparison: Cintas Corporation and Quanta Services, Inc. Trends
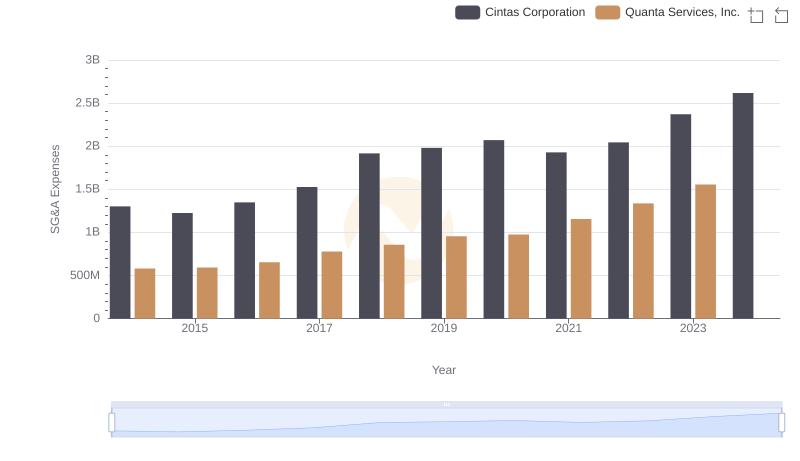
Who Optimizes SG&A Costs Better? Cintas Corporation or Quanta Services, Inc.
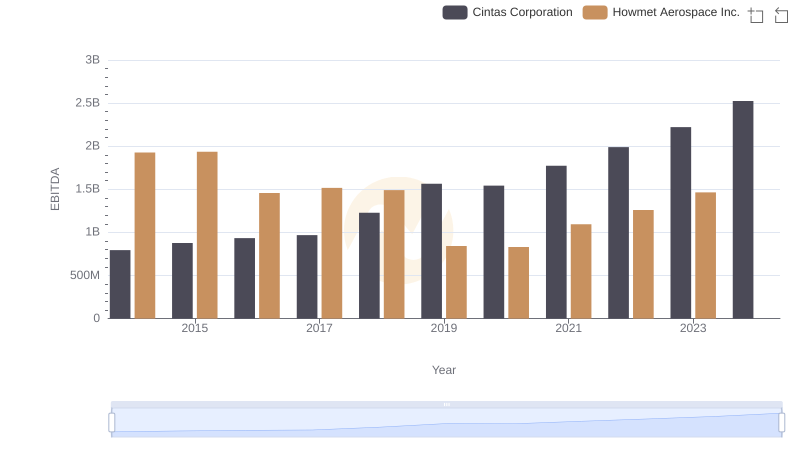
Professional EBITDA Benchmarking: Cintas Corporation vs Howmet Aerospace Inc.
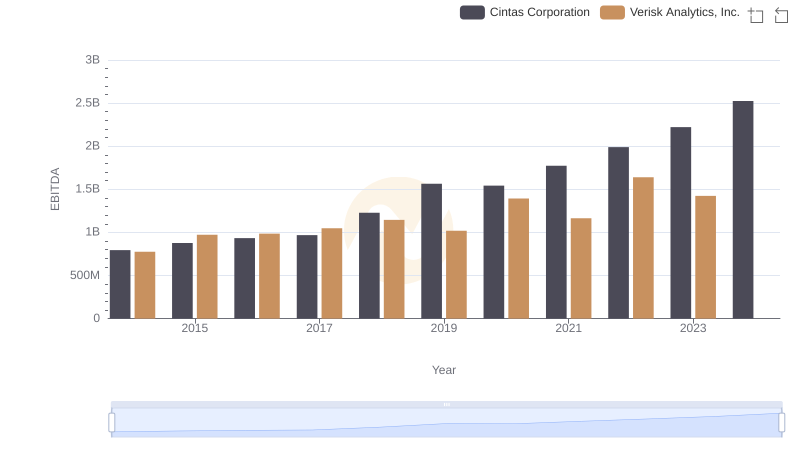
A Side-by-Side Analysis of EBITDA: Cintas Corporation and Verisk Analytics, Inc.
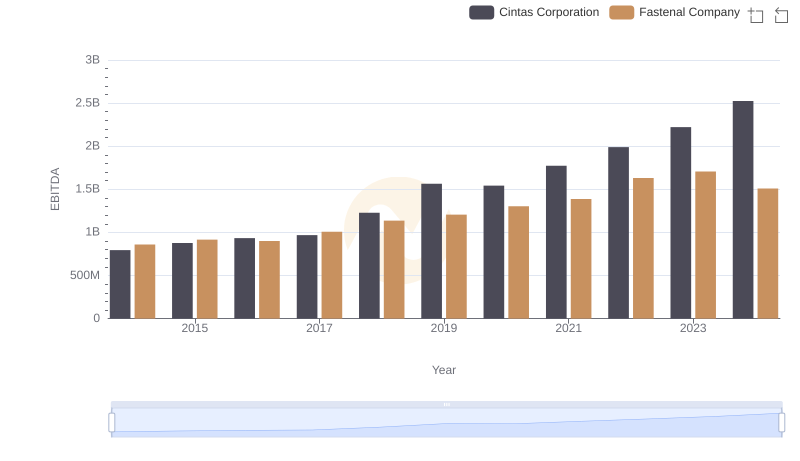
EBITDA Analysis: Evaluating Cintas Corporation Against Fastenal Company
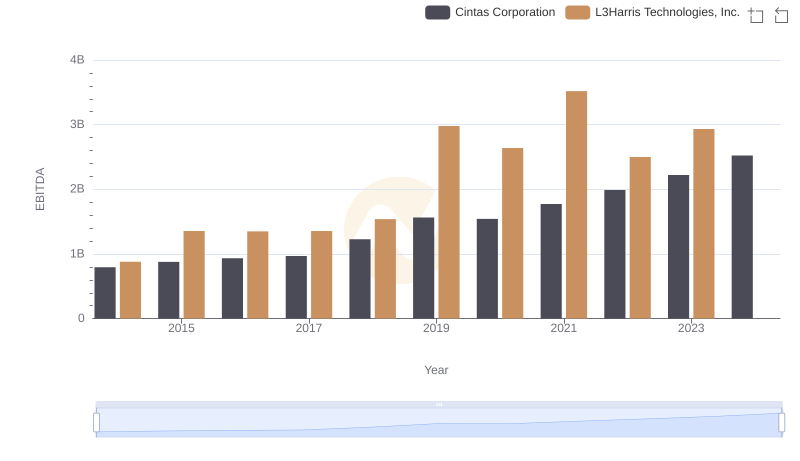
Comprehensive EBITDA Comparison: Cintas Corporation vs L3Harris Technologies, Inc.
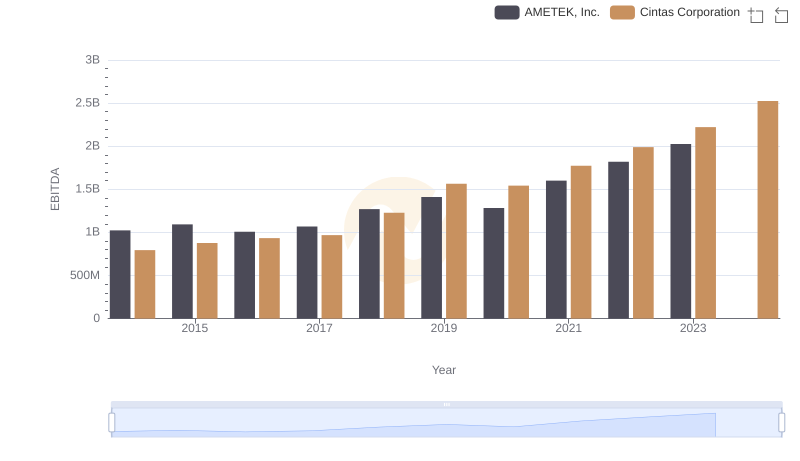
Cintas Corporation vs AMETEK, Inc.: In-Depth EBITDA Performance Comparison
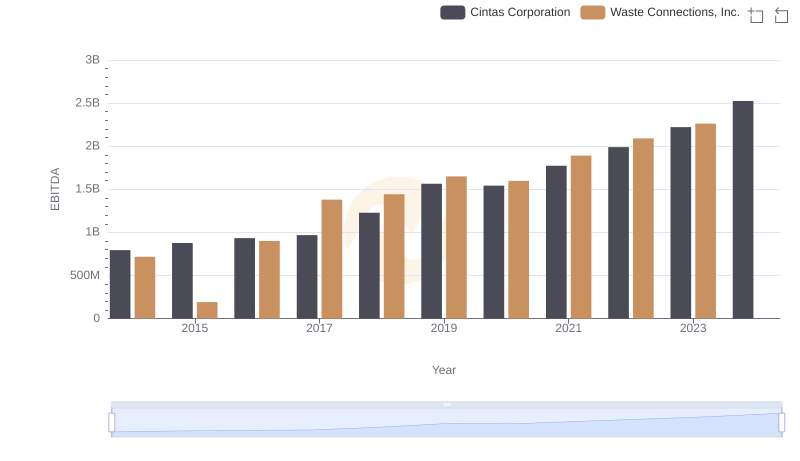
A Side-by-Side Analysis of EBITDA: Cintas Corporation and Waste Connections, Inc.
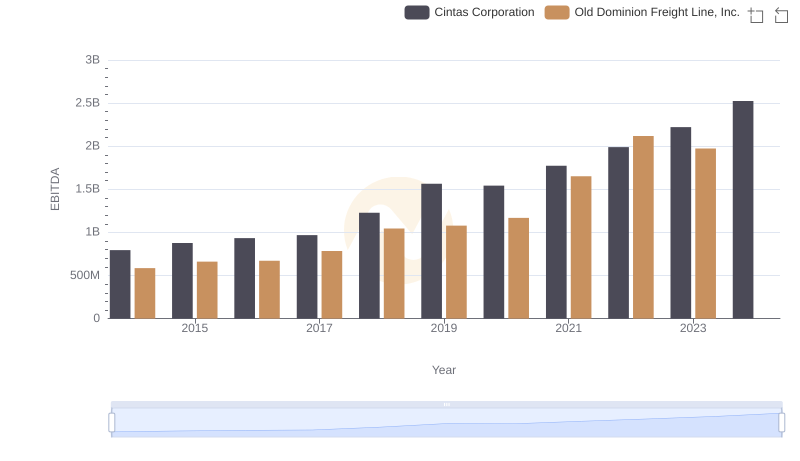
Professional EBITDA Benchmarking: Cintas Corporation vs Old Dominion Freight Line, Inc.
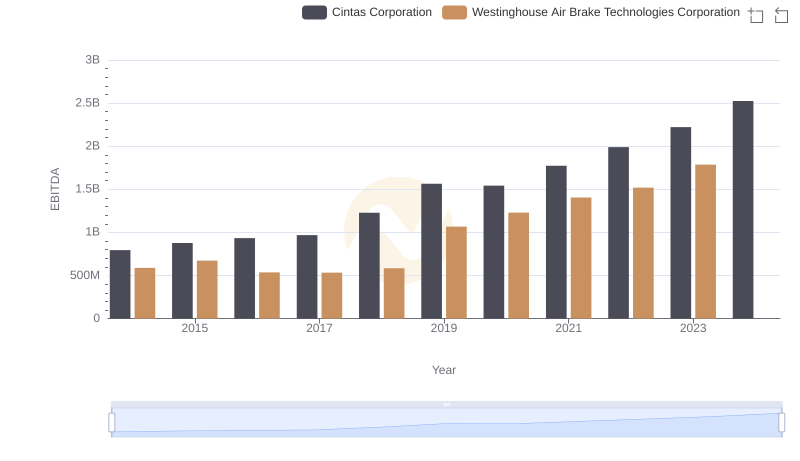
Comprehensive EBITDA Comparison: Cintas Corporation vs Westinghouse Air Brake Technologies Corporation