| __timestamp | AerCap Holdings N.V. | United Rentals, Inc. |
|---|---|---|
| Wednesday, January 1, 2014 | 1282919000 | 2432000000 |
| Thursday, January 1, 2015 | 1822255000 | 2480000000 |
| Friday, January 1, 2016 | 1686404000 | 2403000000 |
| Sunday, January 1, 2017 | 1660054000 | 2769000000 |
| Monday, January 1, 2018 | 1500345000 | 3364000000 |
| Tuesday, January 1, 2019 | 1678249000 | 3670000000 |
| Wednesday, January 1, 2020 | 1276496000 | 3183000000 |
| Friday, January 1, 2021 | 1301517000 | 3853000000 |
| Saturday, January 1, 2022 | 2109708000 | 4996000000 |
| Sunday, January 1, 2023 | 4337648000 | 5813000000 |
| Monday, January 1, 2024 | 6150000000 |
Unleashing the power of data
In the dynamic world of finance, understanding the gross profit trends of industry giants like United Rentals, Inc. and AerCap Holdings N.V. offers valuable insights. Over the past decade, United Rentals has consistently outperformed AerCap Holdings in terms of gross profit. From 2014 to 2023, United Rentals saw a remarkable increase of approximately 139%, peaking at $5.8 billion in 2023. In contrast, AerCap Holdings experienced a more modest growth of around 238%, reaching $4.3 billion in the same year.
The data for 2024 is incomplete, highlighting the importance of continuous monitoring for future trends. This analysis underscores the resilience and strategic prowess of these companies in navigating economic challenges.
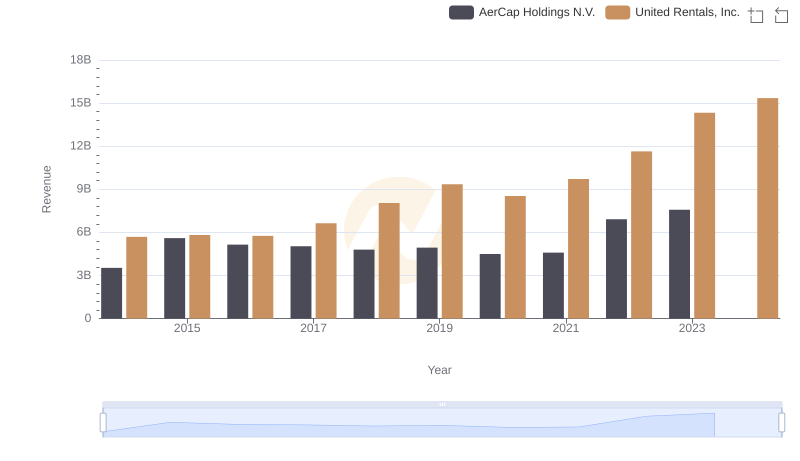
United Rentals, Inc. vs AerCap Holdings N.V.: Annual Revenue Growth Compared
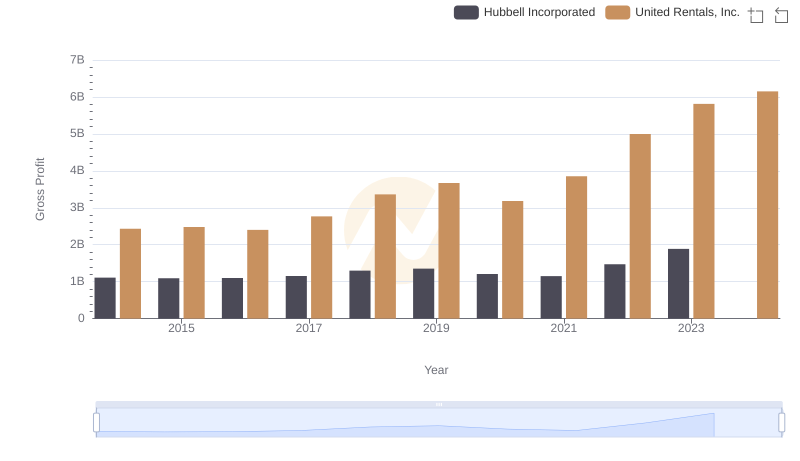
Who Generates Higher Gross Profit? United Rentals, Inc. or Hubbell Incorporated
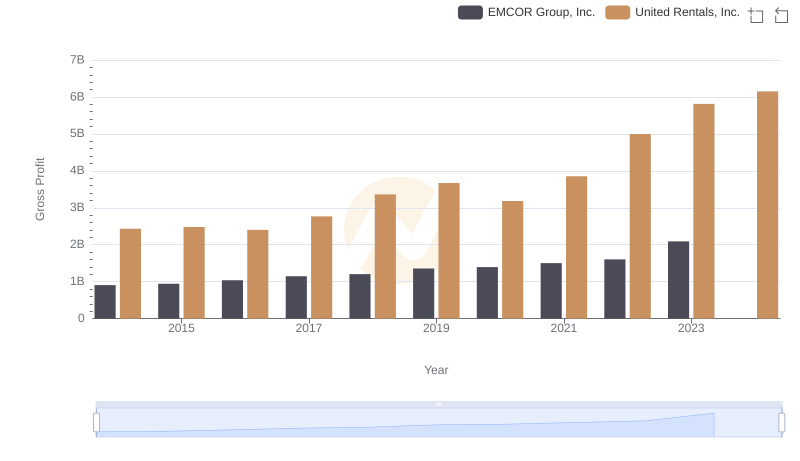
United Rentals, Inc. and EMCOR Group, Inc.: A Detailed Gross Profit Analysis
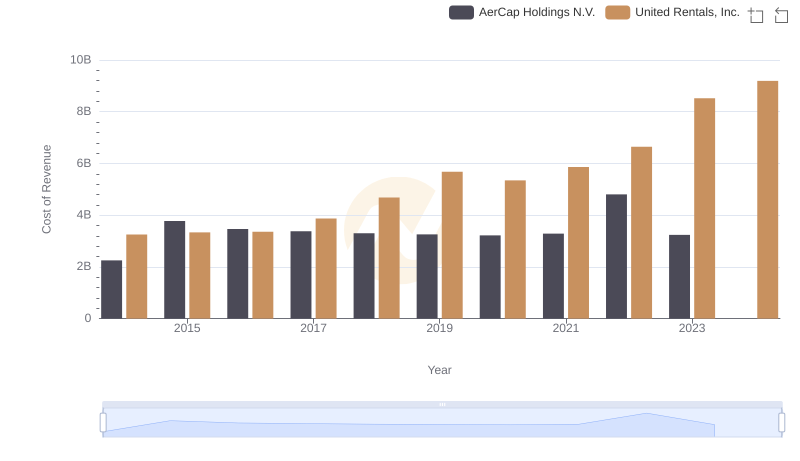
Cost Insights: Breaking Down United Rentals, Inc. and AerCap Holdings N.V.'s Expenses
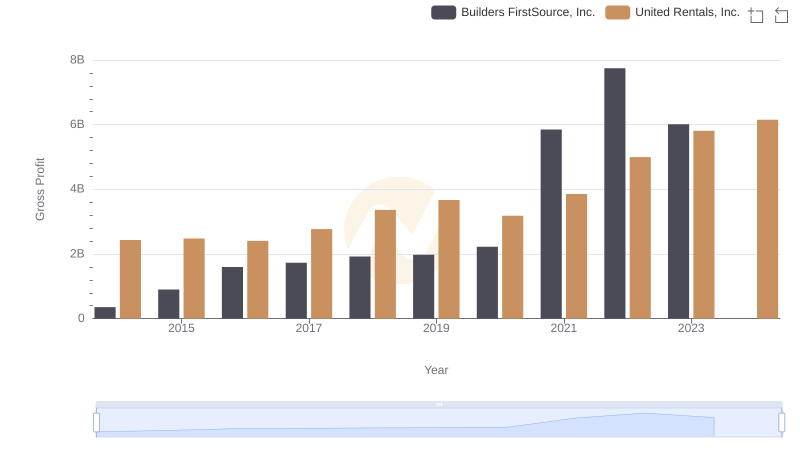
Gross Profit Comparison: United Rentals, Inc. and Builders FirstSource, Inc. Trends
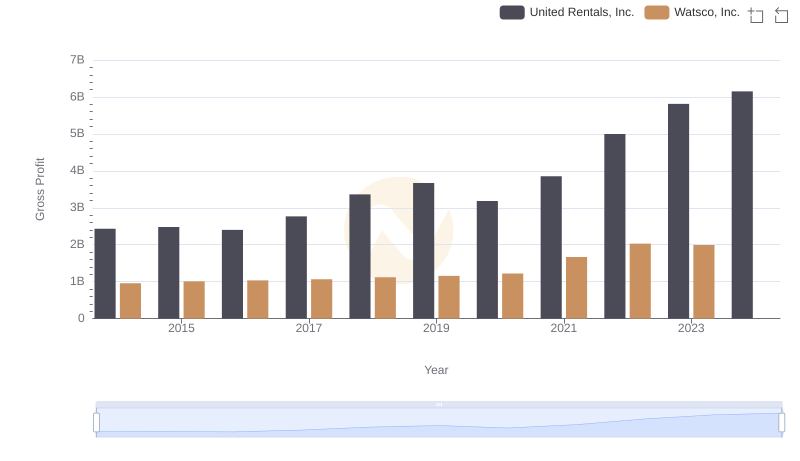
Gross Profit Analysis: Comparing United Rentals, Inc. and Watsco, Inc.
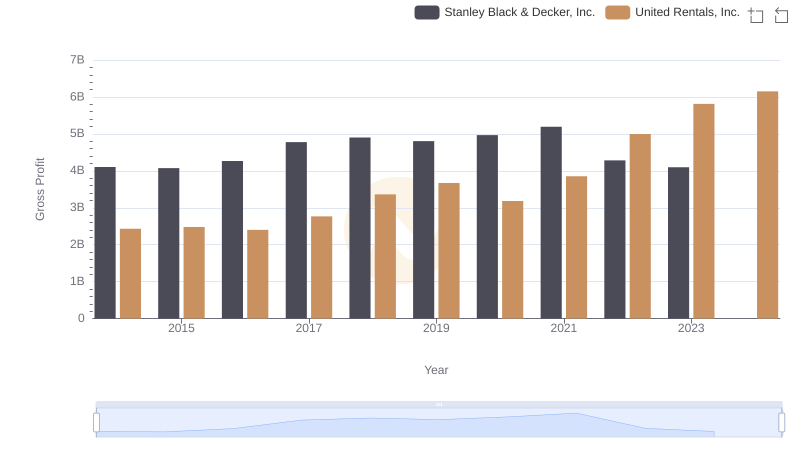
Gross Profit Analysis: Comparing United Rentals, Inc. and Stanley Black & Decker, Inc.
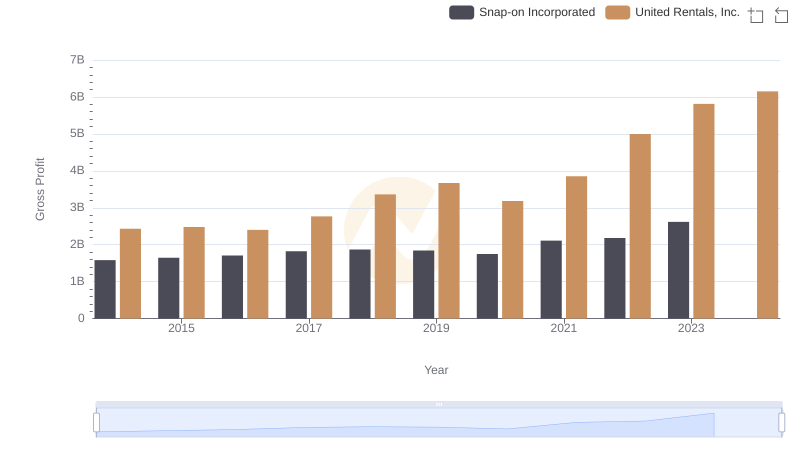
Gross Profit Analysis: Comparing United Rentals, Inc. and Snap-on Incorporated
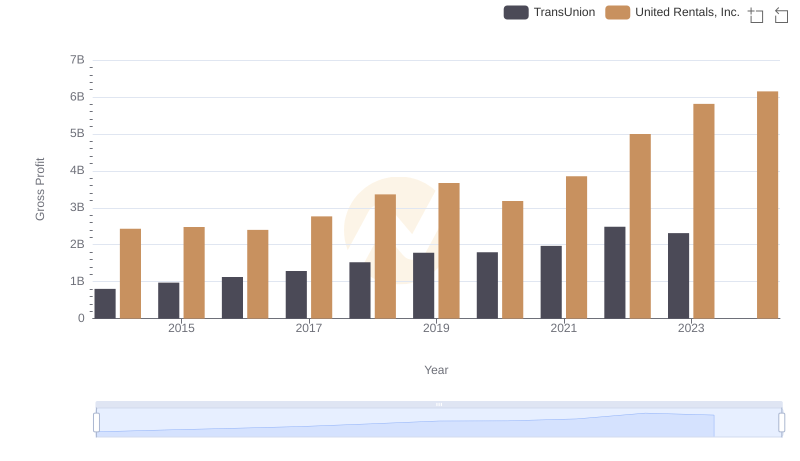
United Rentals, Inc. and TransUnion: A Detailed Gross Profit Analysis
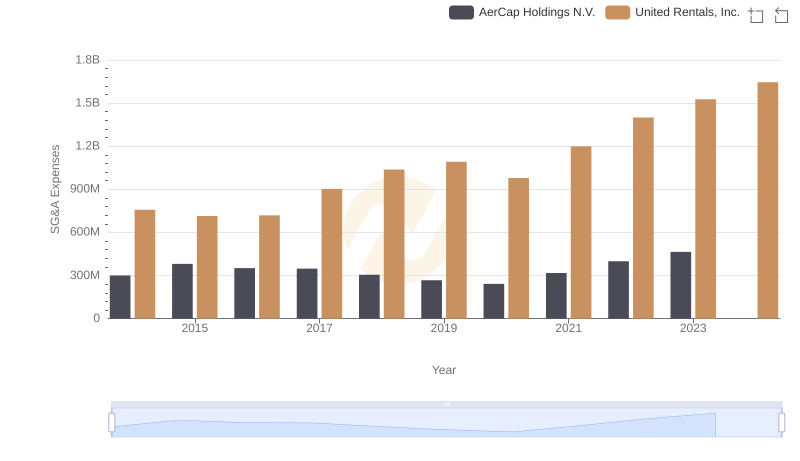
Cost Management Insights: SG&A Expenses for United Rentals, Inc. and AerCap Holdings N.V.
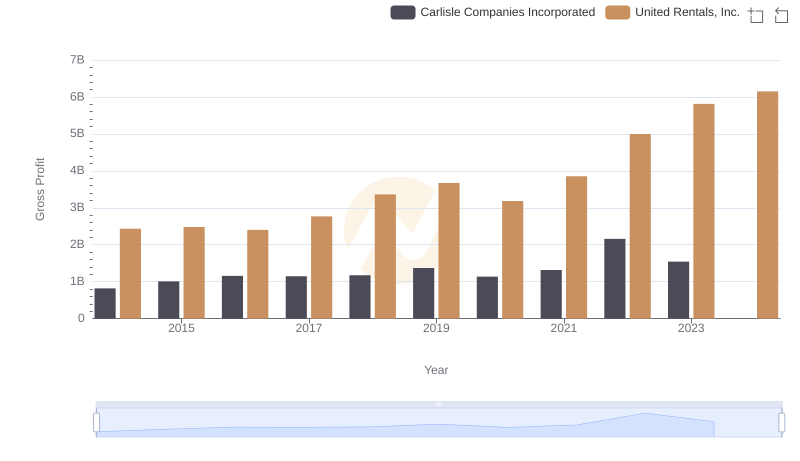
Gross Profit Comparison: United Rentals, Inc. and Carlisle Companies Incorporated Trends
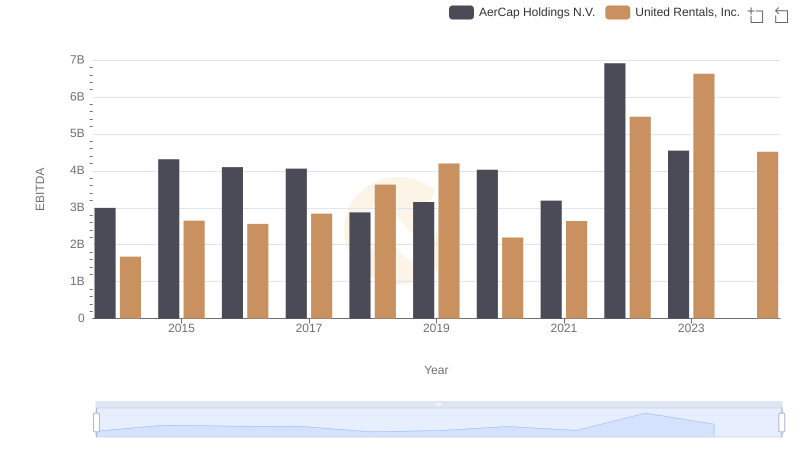
Comparative EBITDA Analysis: United Rentals, Inc. vs AerCap Holdings N.V.