| __timestamp | Intuit Inc. | Teradyne, Inc. |
|---|---|---|
| Wednesday, January 1, 2014 | 3838000000 | 878808000 |
| Thursday, January 1, 2015 | 3467000000 | 915643000 |
| Friday, January 1, 2016 | 3942000000 | 959567000 |
| Sunday, January 1, 2017 | 4368000000 | 1223872000 |
| Monday, January 1, 2018 | 4987000000 | 1220394000 |
| Tuesday, January 1, 2019 | 5617000000 | 1339829000 |
| Wednesday, January 1, 2020 | 6301000000 | 1785741000 |
| Friday, January 1, 2021 | 7950000000 | 2206656000 |
| Saturday, January 1, 2022 | 10320000000 | 1867151000 |
| Sunday, January 1, 2023 | 11225000000 | 1536748000 |
| Monday, January 1, 2024 | 12820000000 | 1648927000 |
Unleashing the power of data
In the ever-evolving landscape of technology, financial performance is a key indicator of a company's resilience and growth. Over the past decade, Intuit Inc. has demonstrated a remarkable trajectory in gross profit, showcasing a growth of approximately 233% from 2014 to 2023. This growth reflects Intuit's strategic innovations and market adaptability. In contrast, Teradyne, Inc. has experienced a more modest increase of around 75% in the same period, highlighting its steady yet less aggressive expansion.
From 2014 to 2023, Intuit's gross profit surged from $3.8 billion to an impressive $11.2 billion, while Teradyne's profit rose from $878 million to $1.5 billion. Notably, 2024 data for Teradyne is missing, leaving room for speculation on its future performance. This analysis underscores the dynamic nature of the tech industry and the varying growth strategies of its key players.
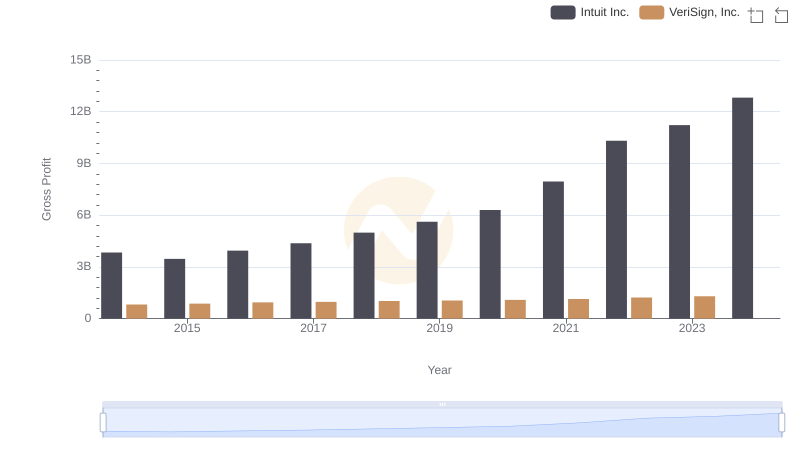
Gross Profit Comparison: Intuit Inc. and VeriSign, Inc. Trends
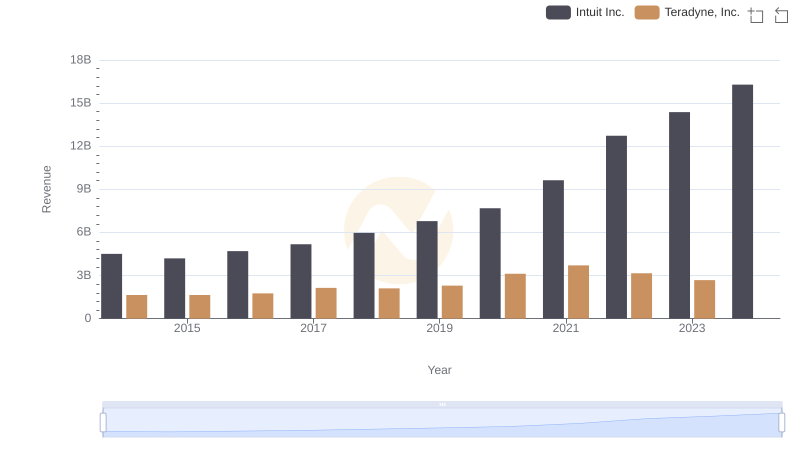
Annual Revenue Comparison: Intuit Inc. vs Teradyne, Inc.
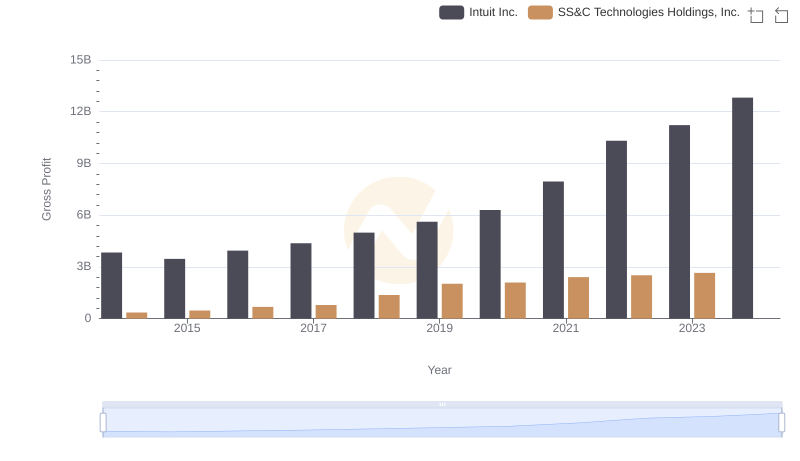
Gross Profit Comparison: Intuit Inc. and SS&C Technologies Holdings, Inc. Trends

Cost of Revenue Comparison: Intuit Inc. vs Teradyne, Inc.
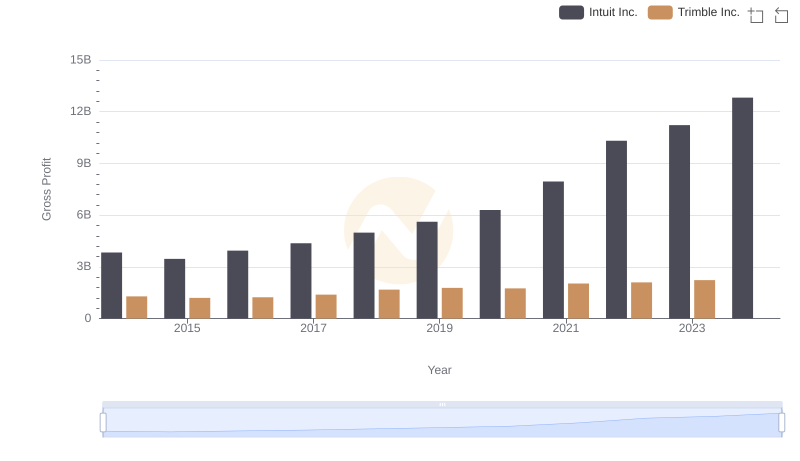
Key Insights on Gross Profit: Intuit Inc. vs Trimble Inc.
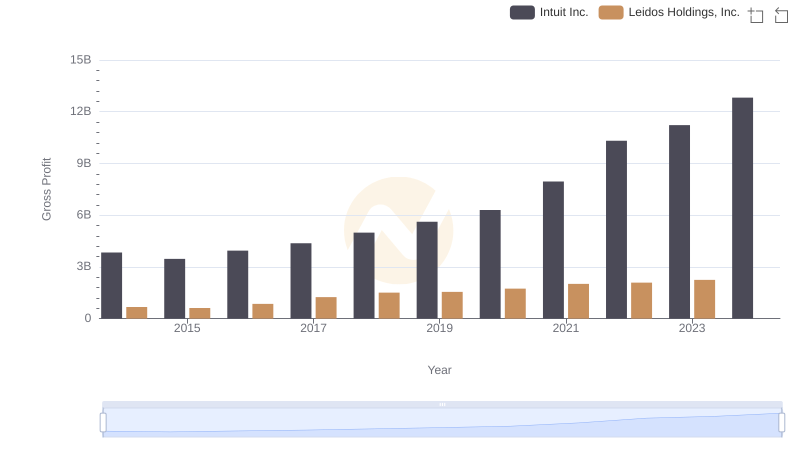
Intuit Inc. and Leidos Holdings, Inc.: A Detailed Gross Profit Analysis
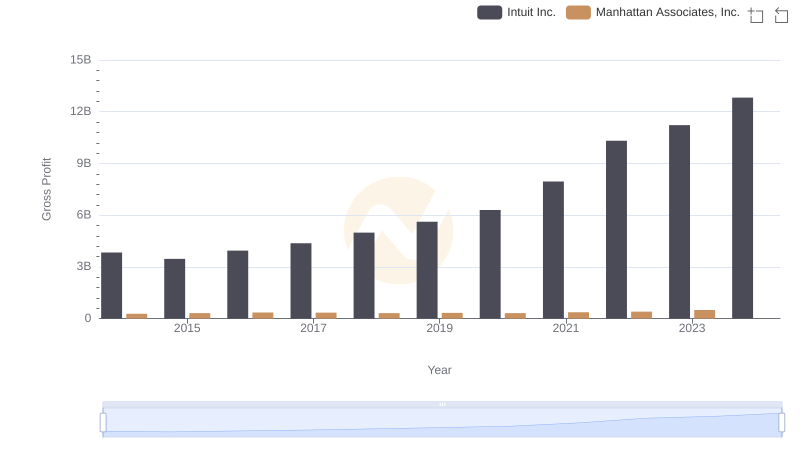
Gross Profit Trends Compared: Intuit Inc. vs Manhattan Associates, Inc.

Research and Development Expenses Breakdown: Intuit Inc. vs Teradyne, Inc.
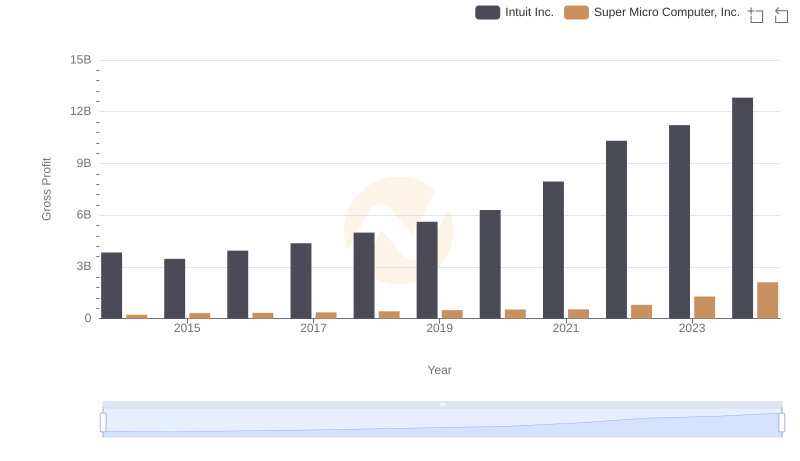
Gross Profit Analysis: Comparing Intuit Inc. and Super Micro Computer, Inc.
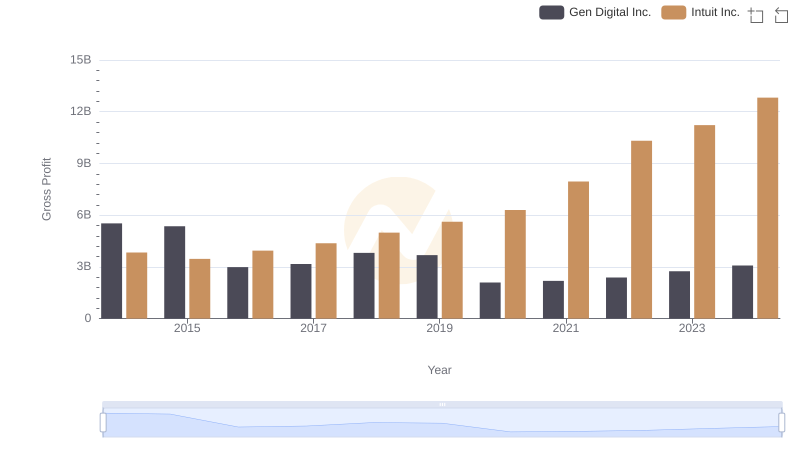
Intuit Inc. vs Gen Digital Inc.: A Gross Profit Performance Breakdown

Intuit Inc. and Teradyne, Inc.: SG&A Spending Patterns Compared
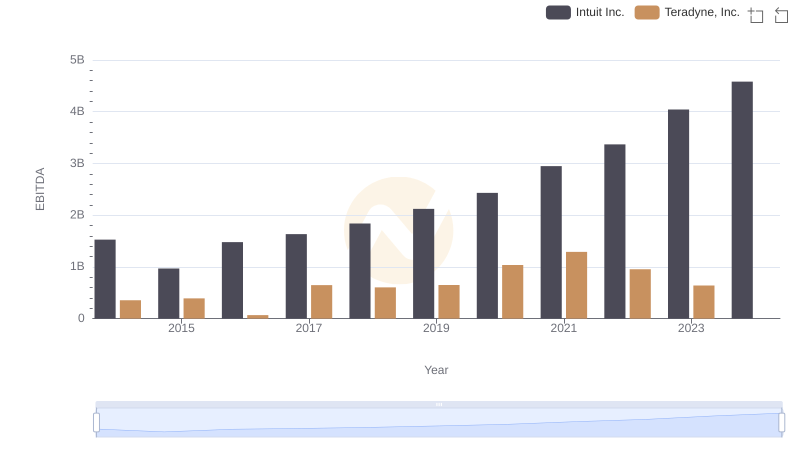
A Side-by-Side Analysis of EBITDA: Intuit Inc. and Teradyne, Inc.