| __timestamp | Intuit Inc. | SS&C Technologies Holdings, Inc. |
|---|---|---|
| Wednesday, January 1, 2014 | 3838000000 | 357130000 |
| Thursday, January 1, 2015 | 3467000000 | 467935000 |
| Friday, January 1, 2016 | 3942000000 | 680947000 |
| Sunday, January 1, 2017 | 4368000000 | 788870000 |
| Monday, January 1, 2018 | 4987000000 | 1370000000 |
| Tuesday, January 1, 2019 | 5617000000 | 2021200000 |
| Wednesday, January 1, 2020 | 6301000000 | 2093800000 |
| Friday, January 1, 2021 | 7950000000 | 2409300000 |
| Saturday, January 1, 2022 | 10320000000 | 2515300000 |
| Sunday, January 1, 2023 | 11225000000 | 2651800000 |
| Monday, January 1, 2024 | 12820000000 | 2863600000 |
Igniting the spark of knowledge
In the ever-evolving landscape of financial technology, Intuit Inc. and SS&C Technologies Holdings, Inc. have emerged as key players. Over the past decade, Intuit has demonstrated a remarkable growth trajectory, with its gross profit surging by over 230% from 2014 to 2023. This growth reflects Intuit's strategic innovations and market adaptability, positioning it as a leader in the industry.
Conversely, SS&C Technologies Holdings, Inc. has also shown significant progress, with its gross profit increasing by approximately 640% during the same period. This impressive growth underscores SS&C's commitment to expanding its market share and enhancing its service offerings.
While Intuit's gross profit reached a peak of $12.82 billion in 2024, SS&C's data for 2024 remains unavailable, leaving room for speculation about its continued growth. This comparison highlights the dynamic nature of the fintech sector and the competitive spirit driving these companies forward.
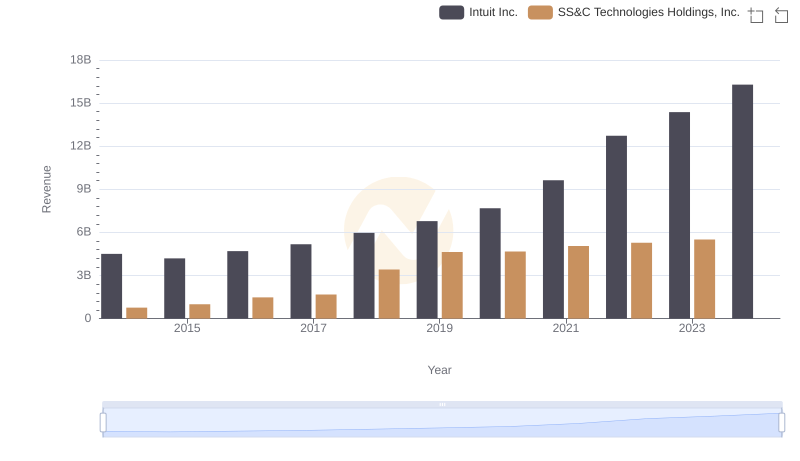
Comparing Revenue Performance: Intuit Inc. or SS&C Technologies Holdings, Inc.?
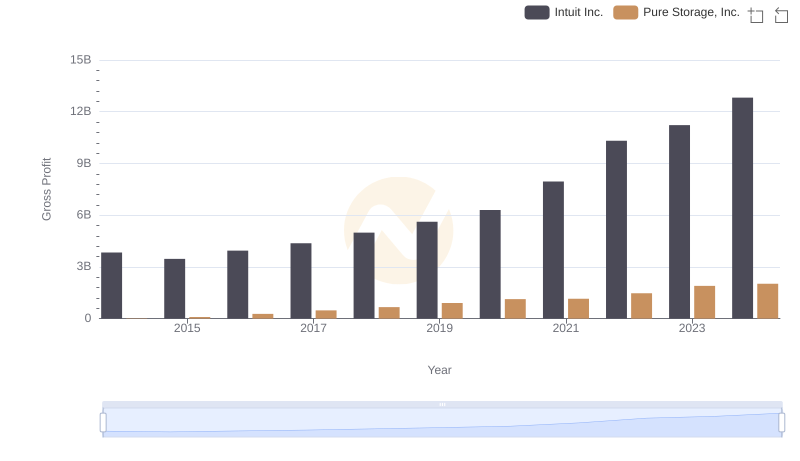
Intuit Inc. vs Pure Storage, Inc.: A Gross Profit Performance Breakdown
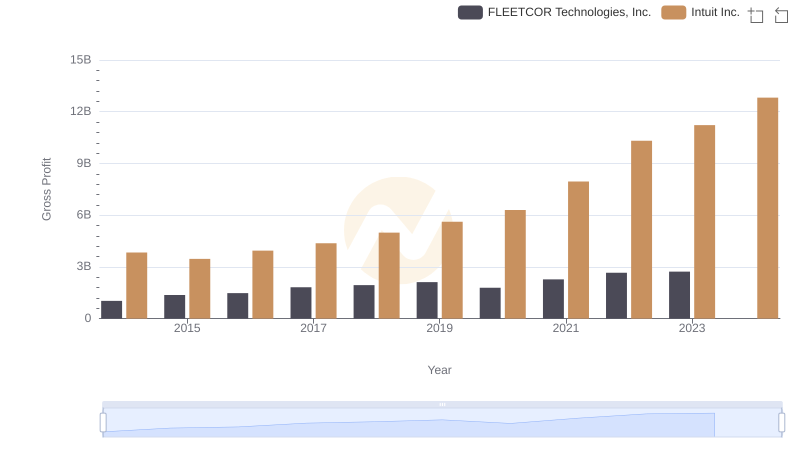
Gross Profit Trends Compared: Intuit Inc. vs FLEETCOR Technologies, Inc.
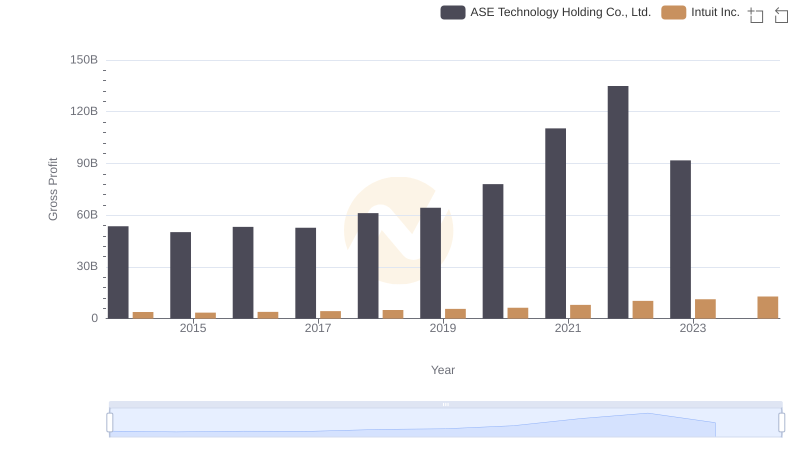
Intuit Inc. vs ASE Technology Holding Co., Ltd.: A Gross Profit Performance Breakdown
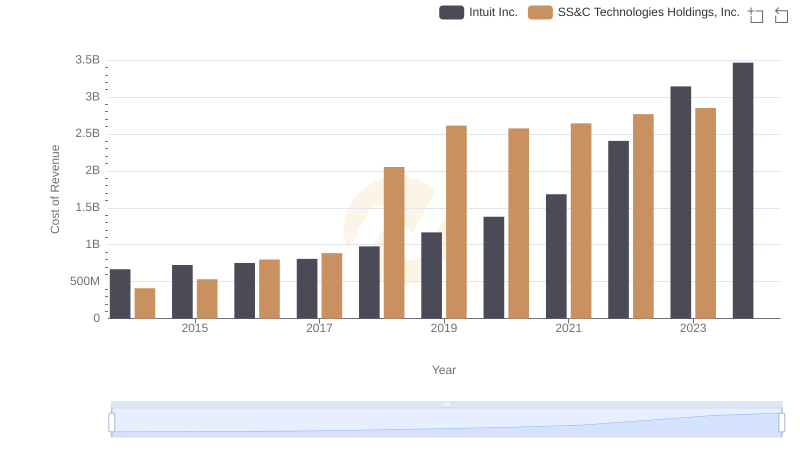
Cost of Revenue Trends: Intuit Inc. vs SS&C Technologies Holdings, Inc.
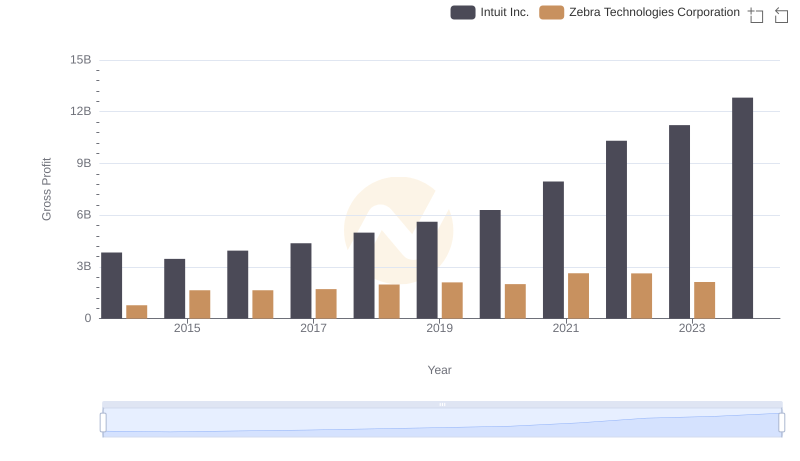
Who Generates Higher Gross Profit? Intuit Inc. or Zebra Technologies Corporation
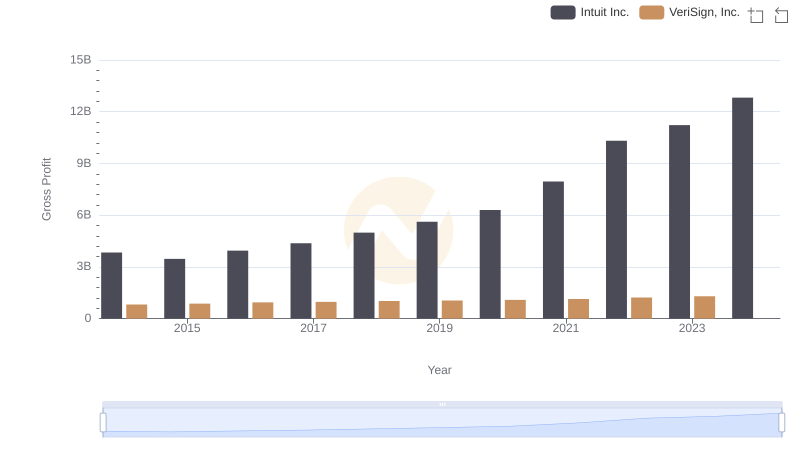
Gross Profit Comparison: Intuit Inc. and VeriSign, Inc. Trends
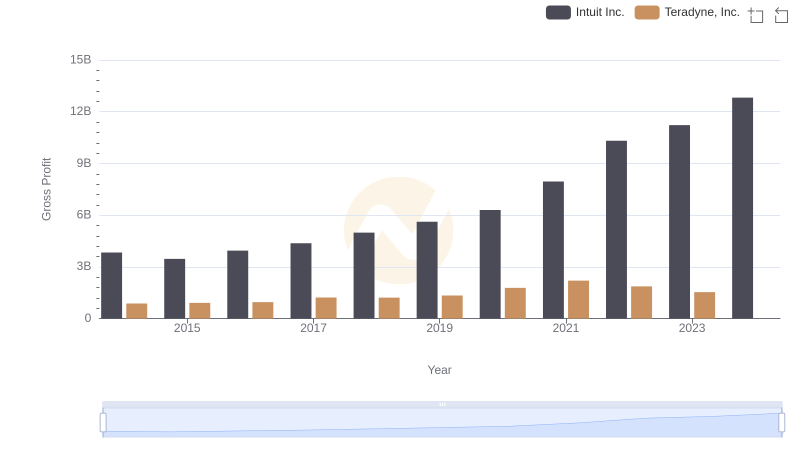
Gross Profit Analysis: Comparing Intuit Inc. and Teradyne, Inc.
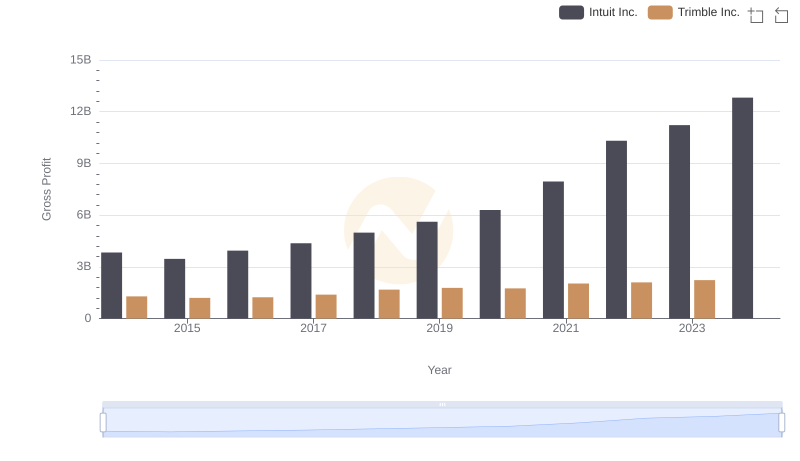
Key Insights on Gross Profit: Intuit Inc. vs Trimble Inc.
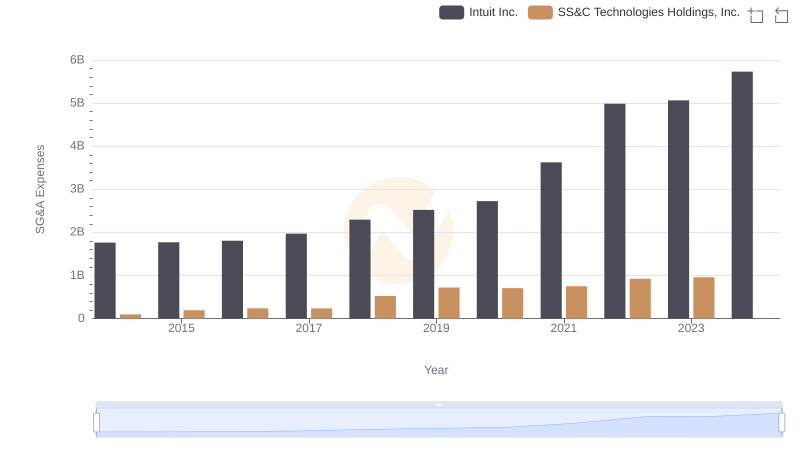
Cost Management Insights: SG&A Expenses for Intuit Inc. and SS&C Technologies Holdings, Inc.
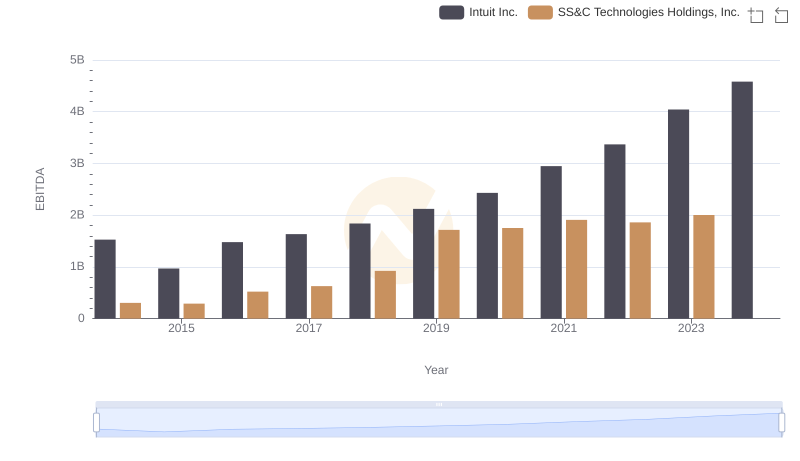
EBITDA Performance Review: Intuit Inc. vs SS&C Technologies Holdings, Inc.