| __timestamp | Intuit Inc. | Teradyne, Inc. |
|---|---|---|
| Wednesday, January 1, 2014 | 1762000000 | 319713000 |
| Thursday, January 1, 2015 | 1771000000 | 306313000 |
| Friday, January 1, 2016 | 1807000000 | 315682000 |
| Sunday, January 1, 2017 | 1973000000 | 348287000 |
| Monday, January 1, 2018 | 2298000000 | 390669000 |
| Tuesday, January 1, 2019 | 2524000000 | 437083000 |
| Wednesday, January 1, 2020 | 2727000000 | 464769000 |
| Friday, January 1, 2021 | 3626000000 | 547559000 |
| Saturday, January 1, 2022 | 4986000000 | 558103000 |
| Sunday, January 1, 2023 | 5062000000 | 571426000 |
| Monday, January 1, 2024 | 5730000000 | 0 |
Unleashing insights
In the ever-evolving landscape of corporate finance, understanding spending patterns is crucial. This chart offers a fascinating glimpse into the SG&A (Selling, General, and Administrative) expenses of two industry giants: Intuit Inc. and Teradyne, Inc., from 2014 to 2023.
Intuit Inc. has shown a remarkable upward trajectory in its SG&A expenses, growing by over 225% from 2014 to 2023. This consistent increase reflects Intuit's strategic investments in marketing and administrative capabilities, crucial for maintaining its competitive edge in the financial software market.
In contrast, Teradyne, Inc. has experienced a more modest growth of approximately 79% over the same period. This steady rise indicates a balanced approach to managing operational costs while expanding its footprint in the semiconductor testing industry.
The data reveals a compelling narrative of strategic financial management, highlighting the distinct paths these companies have taken in their respective sectors.
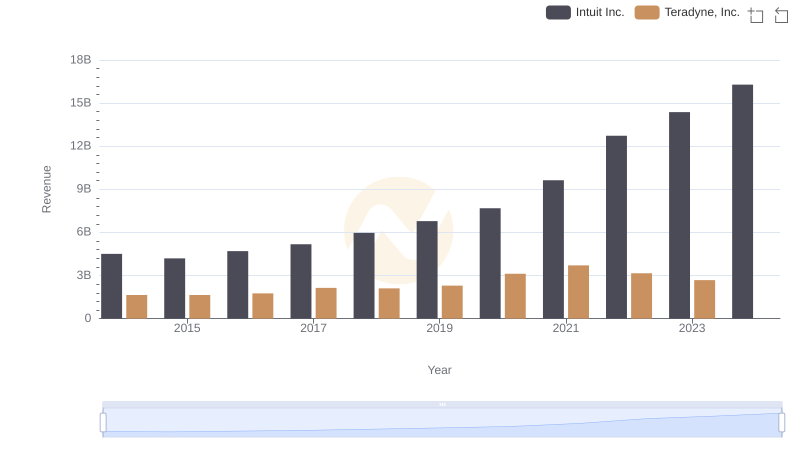
Annual Revenue Comparison: Intuit Inc. vs Teradyne, Inc.

Cost of Revenue Comparison: Intuit Inc. vs Teradyne, Inc.
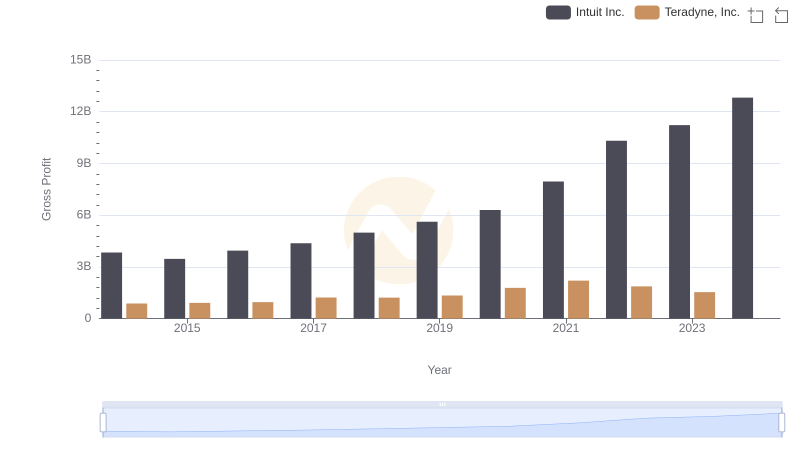
Gross Profit Analysis: Comparing Intuit Inc. and Teradyne, Inc.
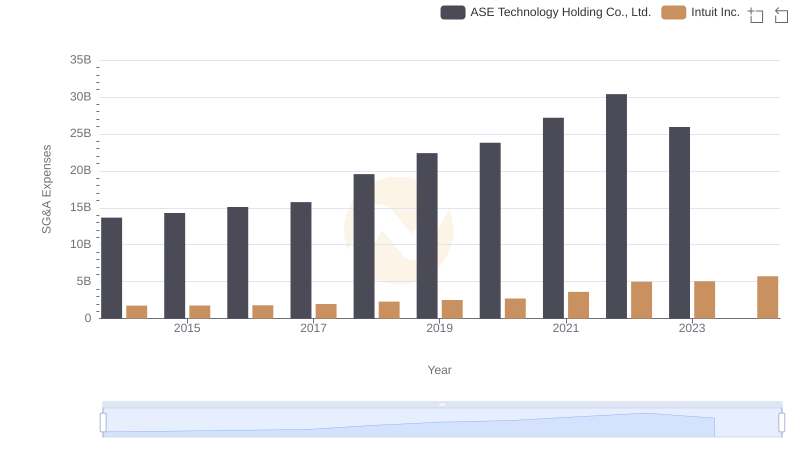
Cost Management Insights: SG&A Expenses for Intuit Inc. and ASE Technology Holding Co., Ltd.
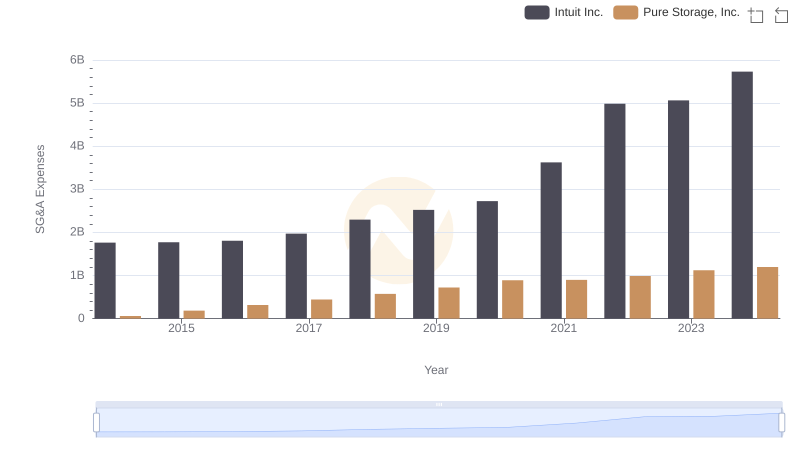
Comparing SG&A Expenses: Intuit Inc. vs Pure Storage, Inc. Trends and Insights

Research and Development Expenses Breakdown: Intuit Inc. vs Teradyne, Inc.
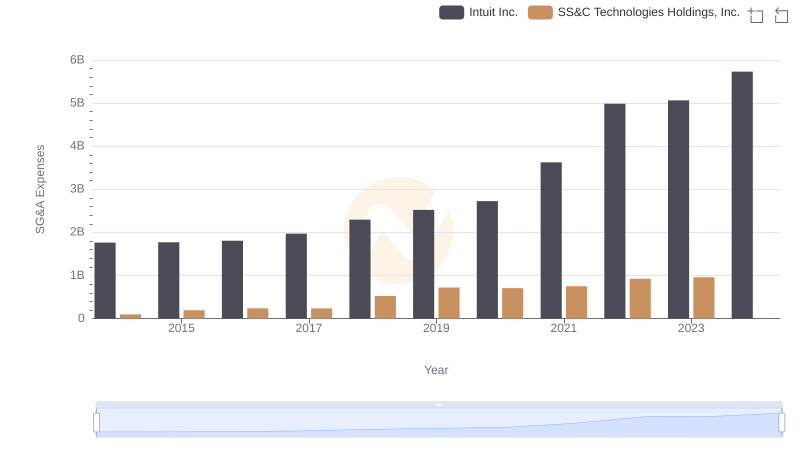
Cost Management Insights: SG&A Expenses for Intuit Inc. and SS&C Technologies Holdings, Inc.
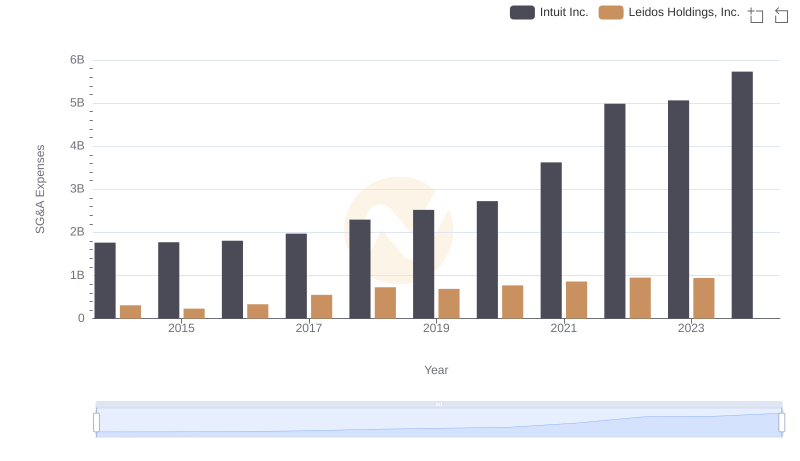
Operational Costs Compared: SG&A Analysis of Intuit Inc. and Leidos Holdings, Inc.
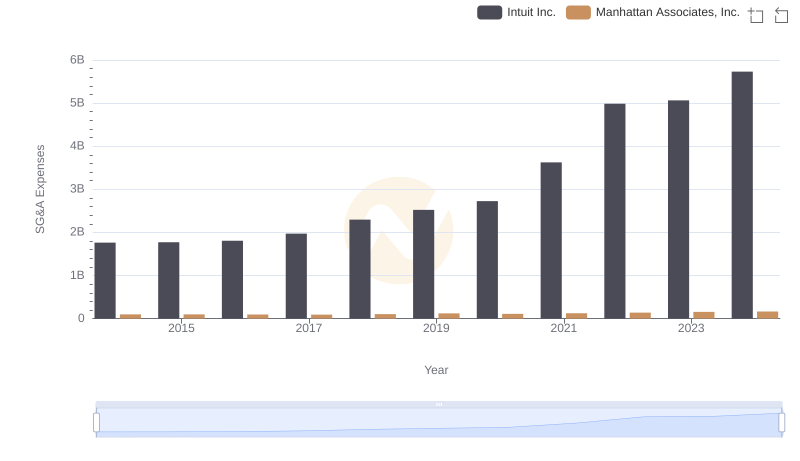
Intuit Inc. vs Manhattan Associates, Inc.: SG&A Expense Trends
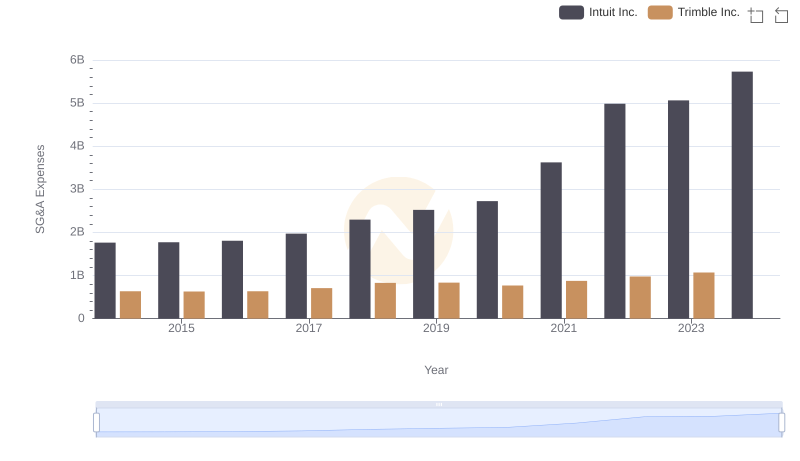
Intuit Inc. or Trimble Inc.: Who Manages SG&A Costs Better?
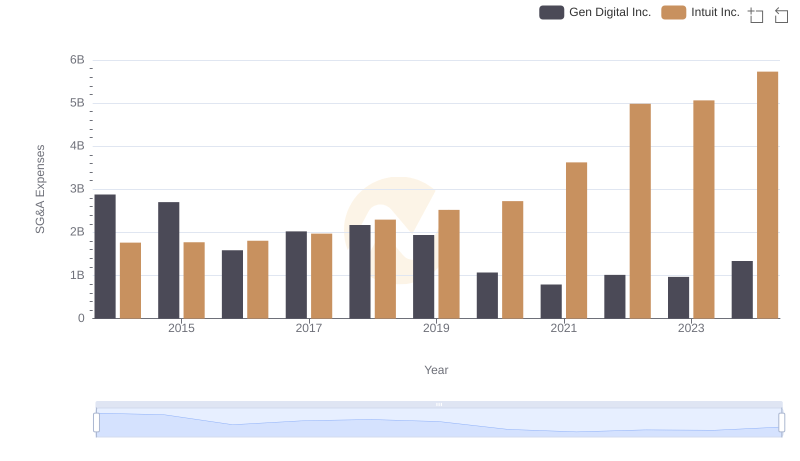
Breaking Down SG&A Expenses: Intuit Inc. vs Gen Digital Inc.
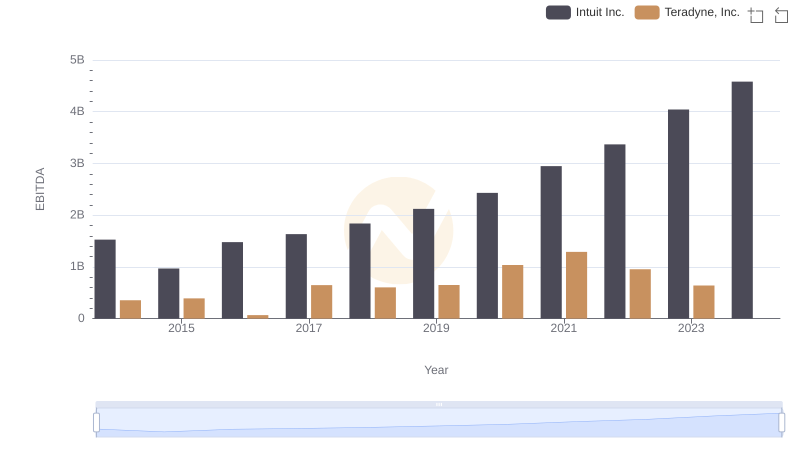
A Side-by-Side Analysis of EBITDA: Intuit Inc. and Teradyne, Inc.